Being appreciated by your peers never gets tired. It really doesn’t!
Teamgate CRM software is continuously evolving, growing, and responding to the ever-changing demands of the people on the frontline of sales.
We know that our software needs to be mobile, always on, and ready to go where your sales teams go. It needs to have the latest integrations, giving you the power to automate the sales tasks that make your life easier, and the route to closed deals smoother. It needs to give you the metrics to measure and analyze what has been, what is, and what will be. Because nothing stays the same. Whether you’re using Sendspark for AI-powered video prospecting or other sales engagement tools, modern CRM platforms need to integrate seamlessly with your entire sales stack.
That’s why when industry standard bearers like GetApp rank Teamgate as a Category Leader – once again – it’s a sure sign that we continue to move in the right direction. And that makes us happy.
As the always positive and forward-thinking Teamgate CEO, Marijus Andrijauskas, likes to remind all of those around him:
“Success is not the key to happiness, happiness is the key to success“.
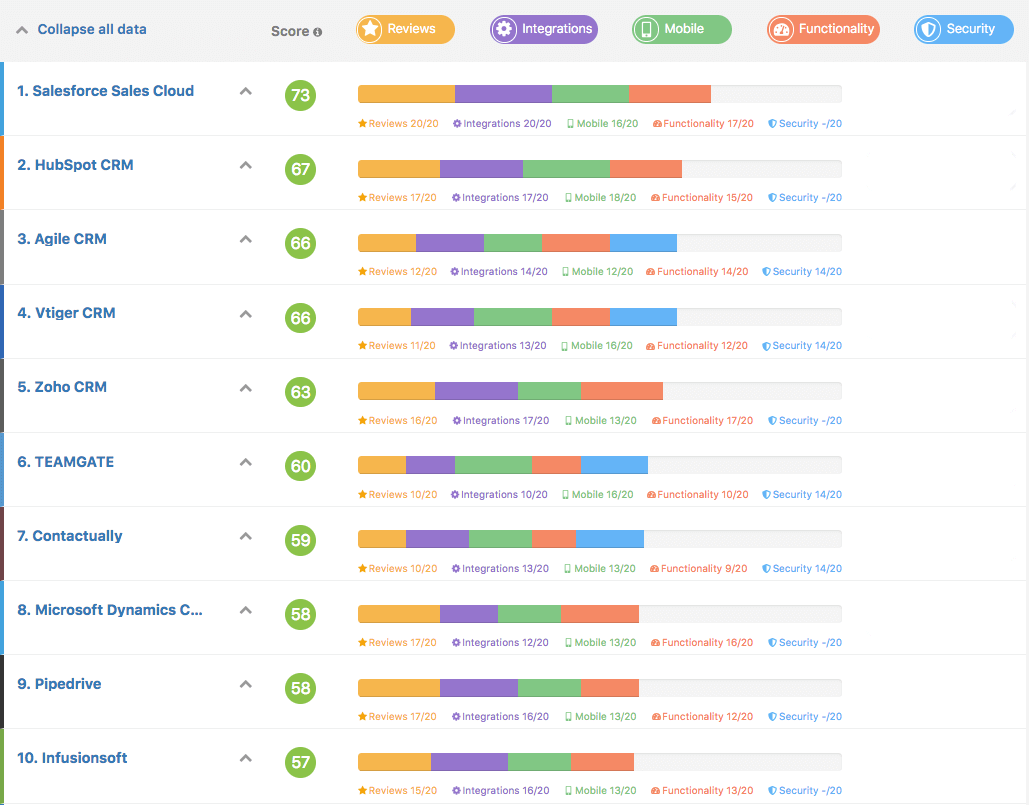
GetApp.com has ranked Teamgate as the #6 best CRM in the global marketplace in the Q4 2018 rankings.
The Ranking
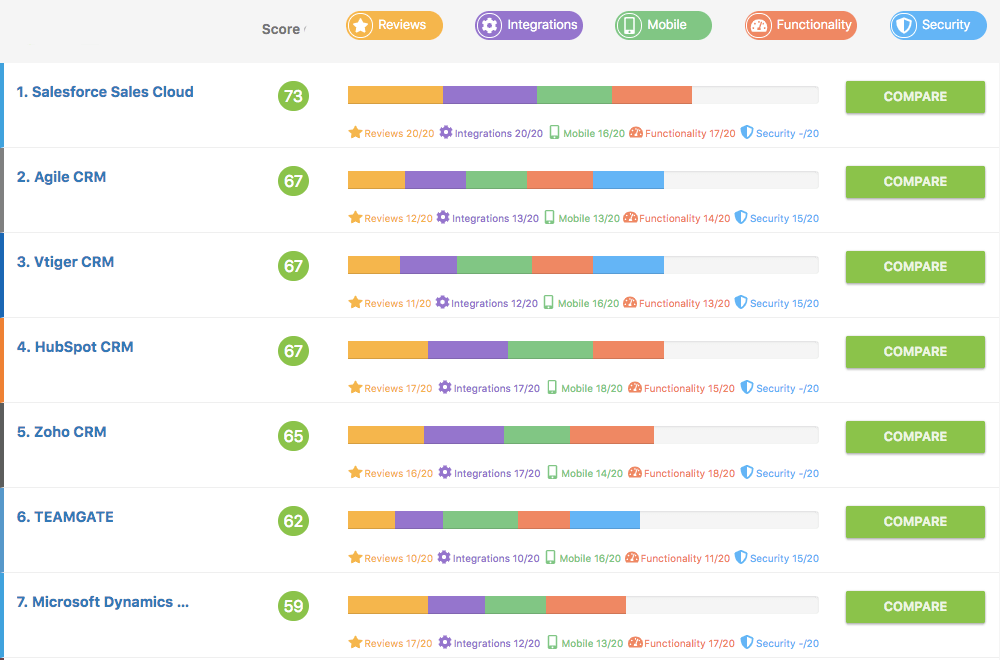
GetApp’s quarterly ranking showcases the leading 10-15 CRM apps based in the cloud. Each app is scored using five factors, worth 20 points each, for a total possible score out of 100. These factors include user reviews, integrations, mobile app availability, functionality, and security. Each app’s score is independent of commercial interests and existing relationships that GetApp has with app vendors.
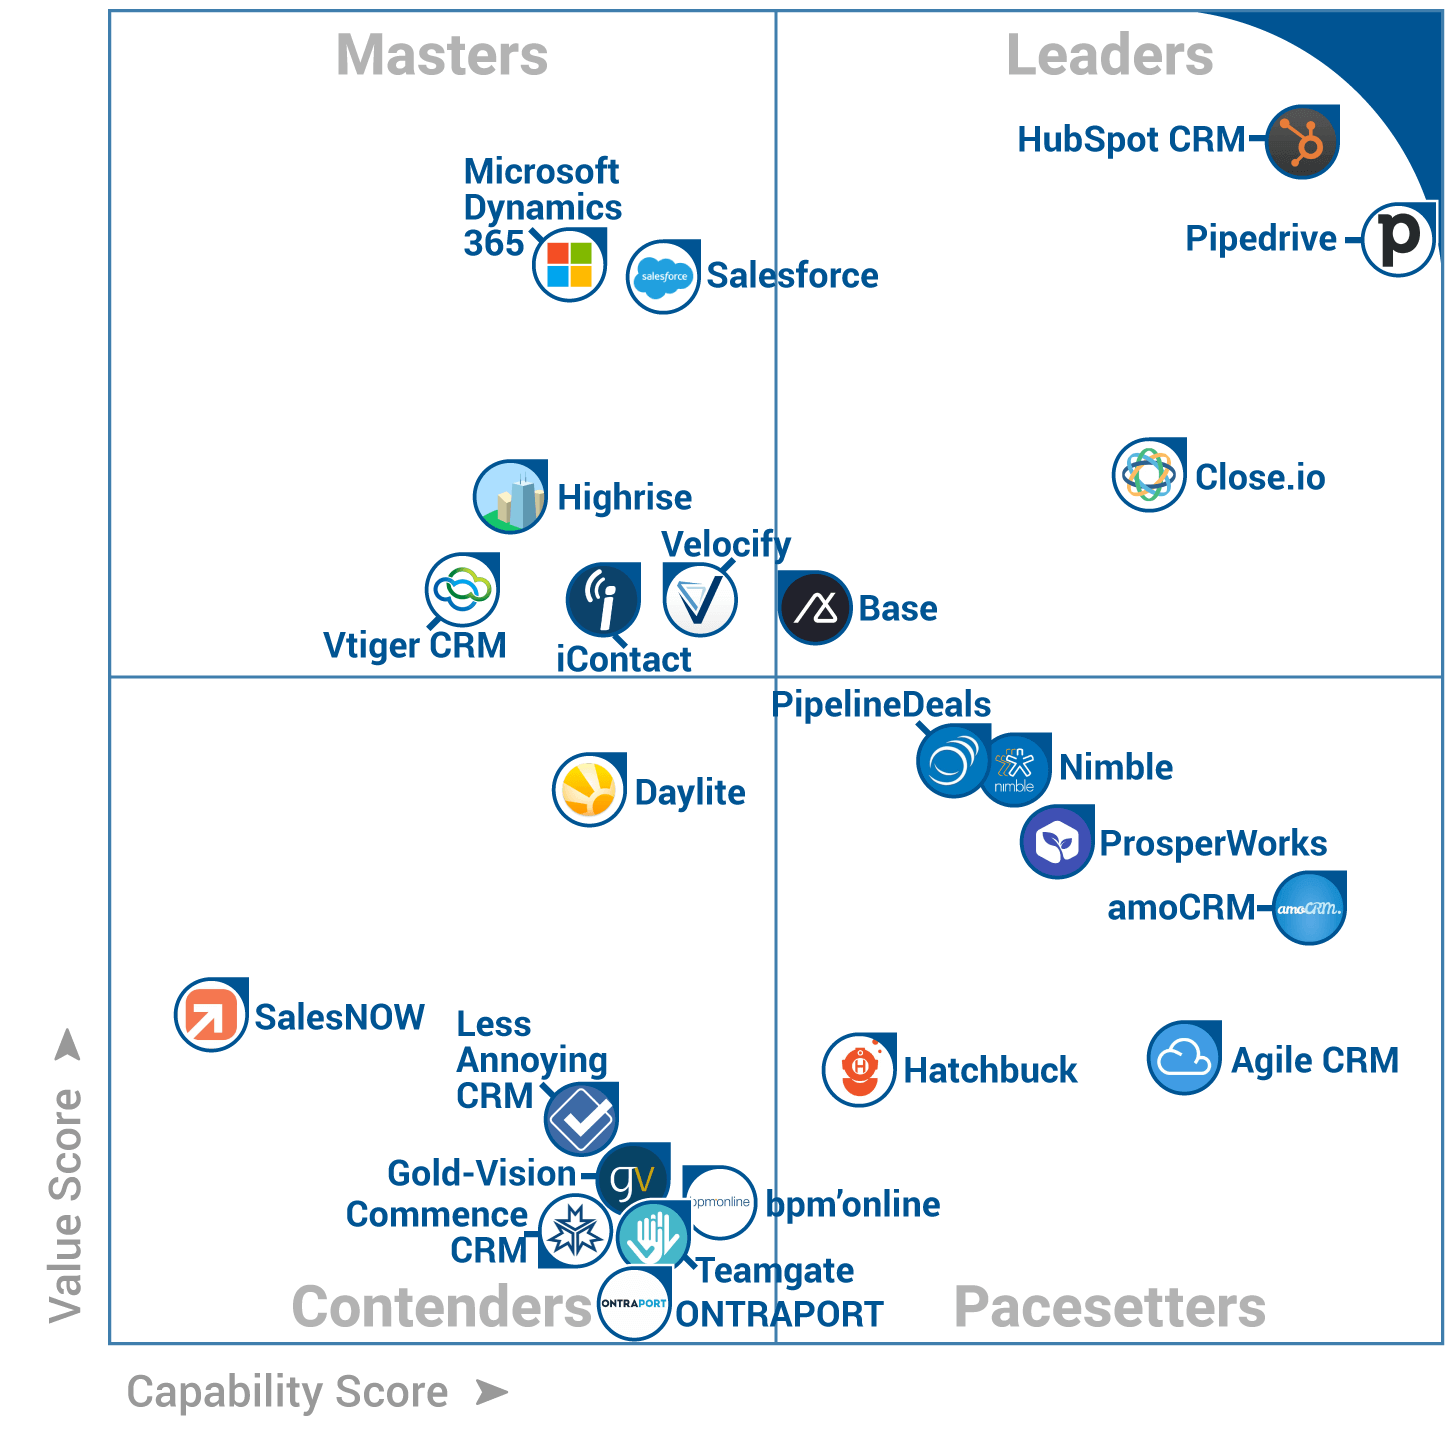
GetApp’s Category Leaders graphic identifies leading cloud-based software products in the CRM software category. If you’re a business owner or decision maker who is evaluating CRM technology options for your company, Category Leaders is for you.
The ranking highlights key factors that small businesses should consider when assessing which software products may be right for them. These factors include user perception (“user reviews”), compatibility with other systems (“integrations”), mobile offerings (“mobile”), technical capabilities (“functionality”), and product security (“security”).
To create each Category Leaders ranking, GetApp’s research team typically evaluates hundreds of products in any one category. The 10-15 with the highest scores become Category Leaders.
How the scores are calculated?
An app’s score is calculated using five unique data points, each scored out of 20, resulting in a total score out of 100. The ranking and scoring methodology ensure complete impartiality and independence from any relationships that GetApp has with app vendors.
The five data points used to rank each app are:
User reviews
Review scores are calculated using weighted reviews collected from GetApp and its sister sites, Software Advice and Capterra. This score is based on average user ratings (on a scale from 1 to 5) of how satisfied users are with a product overall. The scoring includes ratings left within the previous 18-month period; ratings that are more recent are weighted more heavily.
The methodology calculates the percentile ranking for each product relative to all other products in the software category that have qualified for inclusion. That percentile ranking is then translated into a 1 to 20 score.
Integrations
Integration scores factor in a number of variables. Up to 16 points are awarded based on the number of integrations an app has. The first 10 points are awarded based on the number of integrations relative to the category average, while 4 points are awarded based on the number of integrations relative to the leaders in the category. An additional 5 points is awarded for an integration with Zapier, a widely used software integration platform, while an extra point is given for having an open API. The total possible score for integrations is 20 points.
Mobile Platforms
Mobile scores are calculated based on the availability of an iOS and Android app. Five points are awarded for the presence of each app, with an additional 10 points awarded for the number and average rating of reviews in both the App Store and Google Play. These review scores are calculated on a scale based on the category average for a maximum of 5 points per platform and an overall maximum score of 20.
If there isn’t a native iOS or Android app, the product’s website is assessed using Google’s PageSpeed Insights to measure mobile usability. A score out of 100 is given, then scaled to a score out of 5 for a maximum of 5 points.
Functionality
Functionality scores are assigned based on a combination of two assessments: user ratings and functionality breadth data.
Fifty per cent of the score is based on average user ratings on a scale from 1 to 5 of how satisfied users are with the product’s functionality. The scoring includes ratings left within the previous 18-month period; ratings that are more recent are weighted more heavily.
The methodology calculates the percentile ranking for each product relative to all other products in the software category that have qualified for inclusion. That percentile ranking is then translated into a 1 to 10 score.
The other 50% of the score is based on a functionality assessment of the product. For each software category, GetApp’s research analysts define a core set of features that a product must offer, as well as additional “nice-to-have” common and optional features. For the CRM category, we identify the following set of features:
- Core features: contact management, interaction tracking, and lead management.
- Common features (at least two of the following): email marketing, workflow management/automation, forecasting, reporting, or analytics, call management, and lead scoring.
- Optional features: customer support tracking, channel management, social media integration, document management, contact list management, marketing automation, product catalog, quote management, referral tracking, and territory management.
Products are assessed according to how many of those pre-defined features they offer, and products with more features receive a higher score. We use this data to calculate a product’s percentile ranking, which allows us to determine how products compare relative to one another rather than determine an absolute number.
All told, a vendor can receive up to 10 points based on user ratings and up to 10 points based on the features assessment for a total maximum score of 20 for “functionality.”
Security
Security scoring is calculated using answers from a vendor-completed survey. The questions in the survey are based on the Cloud Security Alliance self-assessment form as part of the Security, Trust & Assurance Registry, supplemented by the expertise of GetApp’s security research experts. Each answer in the 16-question survey is assigned a point value. The scoring then calculates the percentile ranking for each product relative to all other products in the software category that have qualified for Category Leaders consideration. That percentile ranking is then translated into a 1 to 20 score.
In the event of a tie, each data point is weighted for importance, with security taking precedent, followed by reviews, integrations, mobile apps, and functionality, respectively.
Click here for a full report on GetRank.
Success doesn’t come in an instant
Some people might say that awards and recognition don’t put the money in the bank. That may, or may not be true.
But, every clap on the back and every word of praise does something else, it makes every one of us at Teamgate know that what we do is valued. That our product is being used by people who really know. And that we are helping countless sales teams get on with their job smarter, easier, and with better results.
That makes us happy. And as we said earlier, ‘…happiness is the key to success“.
Sign up today for your Teamgate free trial, and begin your journey to success.
GET READY TO OWN YOUR WORKDAY
with the most user-friendly CRM on the market.
Painless setup, no credit card required