
Role-based sales dashboards simplify decision-making by showing each team member only the metrics they need. Sales reps see actionable tasks like pipeline aging and quota progress, while managers focus on team performance trends, and leaders track pipeline health and revenue growth. This targeted approach reduces distractions, improves efficiency, and aligns daily actions with company goals.
Here’s how to create dashboards tailored to each role:
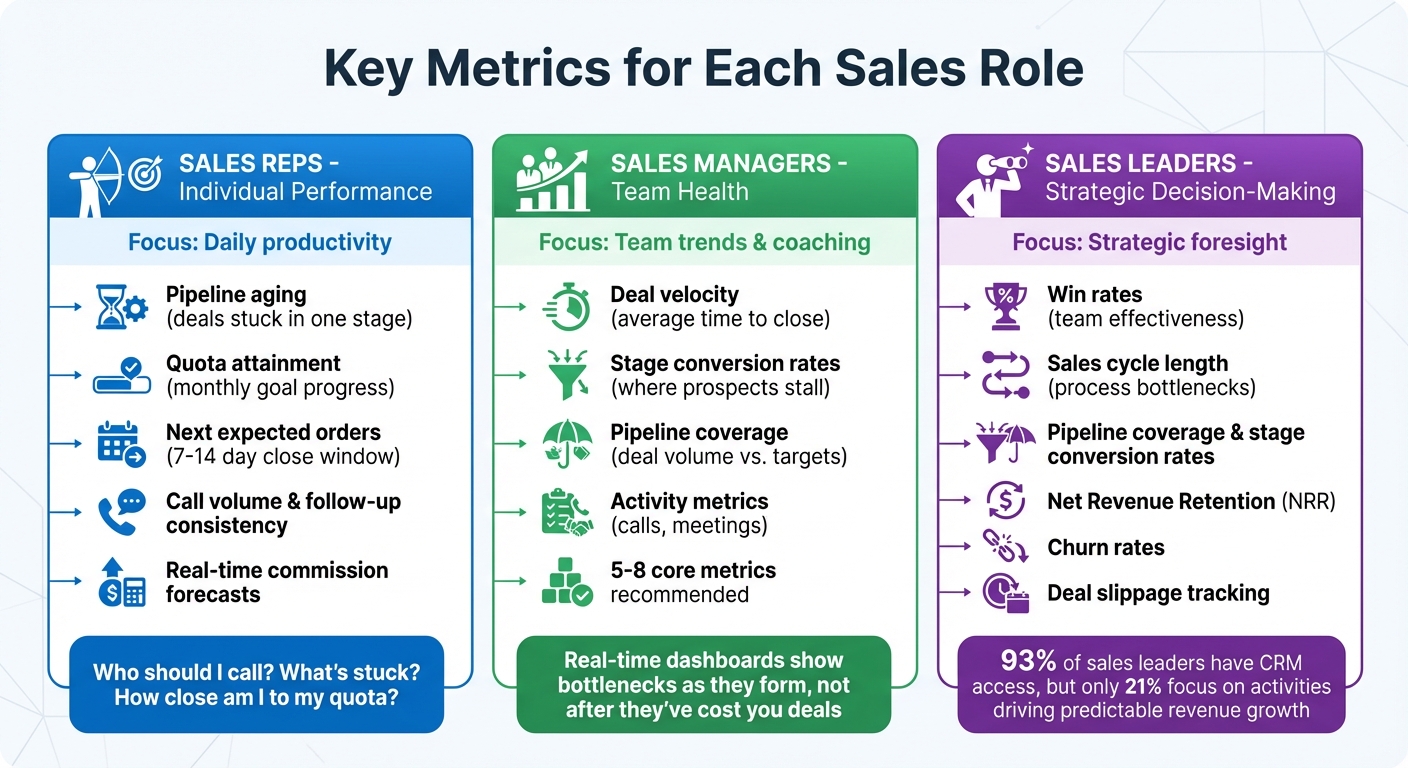
- Sales Reps: Focus on daily productivity with metrics like quota attainment, aging deals, and real-time commission forecasts.
- Managers: Track team health using deal velocity, stage conversion rates, and pipeline coverage.
- Leaders: Use big-picture insights like win rates, sales cycle length, and retention metrics for strategic decisions.
Teamgate CRM makes it easy to build these dashboards with templates, real-time updates, and automation tools. It helps growing sales teams maintain clarity and structure without unnecessary complexity, ensuring every team member stays focused on what matters most.
Key Metrics for Each Sales Role
Role-Based Sales Dashboard Metrics: What Reps, Managers, and Leaders Should Track
To make dashboards truly valuable, focus on metrics that align with the needs of each sales role. This ensures everyone – from reps to leaders – gets actionable insights tailored to their responsibilities.
Sales Reps: Metrics for Individual Performance
For sales reps, the ideal dashboard answers three key questions: Who should I call? What’s stuck? How close am I to my quota?
Key metrics for reps include:
- Pipeline aging: Highlights deals that have lingered too long in one stage, signaling where attention is needed.
- Quota attainment: Tracks progress toward monthly goals.
- Next expected orders: Identifies deals likely to close within the next 7–14 days.
Activity metrics like call volume and follow-up consistency provide real-time feedback, helping reps adjust mid-week. As Sean O’Connor from monday.com puts it, "A rep who sees declining activity metrics on Tuesday adjusts their schedule for the rest of the week." Additionally, real-time commission forecasts keep reps motivated by showing the financial impact of their current deals.
Sales Managers: Metrics for Team Health
For managers, dashboards should shift the focus from individual performance to team-wide trends and coaching opportunities.
Key metrics include:
- Deal velocity: Tracks the average time to close, helping identify delays.
- Stage conversion rates: Pinpoints where prospects tend to stall in the pipeline.
- Pipeline coverage: Ensures there’s enough deal volume to hit team targets.
Activity metrics like call volume and scheduled meetings help managers distinguish between low activity and deeper performance issues. When deals linger in a stage longer than the average velocity, managers can step in before opportunities go cold. Sean O’Connor from monday.com emphasizes the importance of real-time insights:
"Real-time dashboards show you what’s happening now and what needs your attention immediately… You spot bottlenecks as they form, not after they’ve cost you deals."
To avoid information overload, manager dashboards typically feature 5 to 8 core metrics, keeping the focus on insights that drive coaching and team improvement.
Sales Leaders: Metrics for Decision-Making
For sales leaders, the goal is to use dashboards for strategic foresight, focusing on metrics that predict outcomes and address systemic challenges.
Although 93% of sales leaders have access to basic CRM metrics, only 21% focus on activities that drive predictable revenue growth. Leaders should prioritize:
- Pipeline coverage and stage-to-stage conversion rates: Leading indicators that provide early warnings about pipeline health.
- Win rates: Measures team effectiveness.
- Sales cycle length: Identifies bottlenecks in the process.
- Net Revenue Retention (NRR) and churn rates (for B2B teams): Gauge long-term customer retention and health.
Tracking deal slippage – opportunities that stall or regress – also allows leaders to intervene before deals are lost entirely. These metrics form the backbone of executive dashboards, offering the visibility needed to make informed, strategic decisions.
How to Build Role-Based Dashboards in Teamgate CRM
Creating role-specific dashboards in Teamgate CRM helps every sales team member focus on the metrics that matter most to their role. Whether you’re a sales rep, manager, or leader, these dashboards ensure you have a clear, actionable view of performance, aligning with Teamgate’s mission to support disciplined selling and protect revenue.
Teamgate’s dashboard builder emphasizes speed and ease of use. Dashboards load in under 3 seconds, making them a seamless part of your daily routine. Follow these steps to design dashboards tailored to each role’s needs.
Step 1: Access the Sales Dashboards Feature
Start by navigating to the Dashboards section in the main menu. From here, you can either access existing dashboards or create a new one.
Step 2: Choose a Template or Start from Scratch
Teamgate provides pre-built templates customized for different roles:
- Sales reps: Dashboards highlight daily tasks and personal goals.
- Managers: Focus on team performance and operational metrics.
- Leaders: Emphasize strategic insights like forecasting and overall health.
If your team has specific requirements, you can opt for a blank dashboard and build it from the ground up.
Step 3: Add Widgets for Core Metrics
Use widgets to display the most relevant metrics for each role:
- Reps: Include metrics like pipeline aging, quota attainment, and next expected orders.
- Managers: Focus on deal velocity, stage conversion rates, and pipeline coverage.
- Leaders: Highlight win rates, sales cycle length, and Net Revenue Retention.
Teamgate also offers a risk management metric that identifies high-risk opportunities, enabling teams to address urgent issues in real time. Simply drag and drop widgets into place to build a dashboard that aligns with your goals.
Step 4: Configure Filters and Real-Time Updates
Apply filters to analyze performance over specific time periods, such as the past year or a custom range. Teamgate’s dashboards update in real time, ensuring you always see the latest pipeline activity without needing to refresh manually. You can also integrate updates with tools like Slack or calendar apps for faster, more collaborative decision-making.
"Your dashboard’s reports and analysis are instant, and always up-to-date".
Step 5: Set Goals and Automate Reminders
Define clear goals for each role:
- Reps: Monthly quotas.
- Managers: Team performance targets.
- Leaders: Revenue objectives.
Leverage Teamgate’s workflow automations to create tasks, reminders, and notifications triggered by specific events. Tools like Zapier or Make.com can help automate notifications across your tech stack, saving time and reducing manual effort. Regularly review and update loss reasons to gain insights into deal failures, allowing managers to adjust strategies quickly.
Customizing Dashboards for Reps, Managers, and Leaders
Different roles within a sales team require distinct views of the pipeline to stay effective. With Teamgate CRM, you can customize dashboards to align with the unique needs of sales reps, managers, and leaders. This approach ensures daily actions tie directly to strategic goals, fostering disciplined selling and a structured sales process for accurate pipeline insights.
Sales Reps: Focused Views for Daily Productivity
Sales reps thrive with dashboards that act as practical, day-to-day tools – not as monitoring systems. Build their dashboards around key elements like:
- Activity goals: Track calls made, meetings scheduled, and tasks completed.
- Upcoming deals: Highlight orders expected to close in the next 7–14 days.
- Real-time commission forecasts: These motivate reps by showing the direct impact of their efforts.
To enhance usability, include filters for date ranges and deal stages, enabling reps to analyze their own performance without outside assistance. Also, prioritize fast load times – under 3 seconds – to maintain engagement and ease of use.
Sales Managers: Clear Metrics for Team Oversight
Managers need dashboards that provide a comprehensive view of team performance, helping them identify bottlenecks, coaching opportunities, and pipeline health. Focus on metrics such as:
- Deal velocity: Average time to close deals.
- Pipeline coverage: The ratio of pipeline value to quota.
- Stage conversion rates: How effectively deals move through each stage.
- Activity-to-outcome ratios: Calls per meeting and meetings per closed deal.
Incorporate funnel visualizations to identify where prospects stall and to pinpoint bottlenecks . Use conditional labels or automated flags to highlight at-risk deals, like those sitting idle for too long without activity. This data-driven approach transforms coaching from guesswork into actionable feedback on skill gaps or effort issues.
Sales Leaders: Big-Picture Insights for Strategy
Sales leaders require dashboards that answer high-level strategic questions, such as resource allocation, marketing effectiveness, and forecasting accuracy. Prioritize these metrics:
- Win rates: Measure overall success in closing deals.
- Sales cycle length: Track how long deals take to close.
- Pipeline aging: Identify deals at risk of stagnation.
- Marketing ROI by lead source: Evaluate which channels deliver the best results .
Additionally, include risk management metrics to flag high-value deals showing warning signs – like sudden activity drops, prolonged stages, or missing next steps. Leverage weighted forecast amounts (deal value multiplied by stage probability) to separate realistic opportunities from inflated expectations. This ensures resource planning and forecasting are grounded in data, not assumptions.
sbb-itb-5772723
Best Practices for Maintaining and Optimizing Dashboards
Once your role-based dashboards are up and running, keeping them relevant and effective requires regular fine-tuning. Without consistent updates, even the most thoughtfully designed dashboard can become a source of confusion instead of clarity.
Test and Refine with User Feedback
Start with a simple dashboard and improve it over time based on team input. Margaret Rimek from Metabase emphasizes this approach:
"If you want a dashboard that gets used, start simple, build fast, and listen hard. Then iterate. Because usage beats requirements every time".
Focus on answering practical questions like, “Who should I call next?” or “Which deals are stalling?” This ensures the dashboard stays aligned with the team’s daily challenges. Conducting quarterly reviews can help confirm that the metrics continue to reflect current business goals.
Standardize Data Inputs and Sources
A dashboard is only as good as the data it displays. Sean O’Connor from monday.com highlights the risk:
"One incorrect data instance destroys credibility causing users to revert to manual reporting".
To safeguard data integrity in Teamgate CRM, use validation rules that require accurate completion of critical fields before deals move forward. Assign clear data ownership responsibilities and integrate tools like email, marketing automation, and support systems. Automating data updates at regular intervals ensures consistency and reliability. These practices can reduce administrative workload by up to 70%, making dashboards a dependable resource for all sales roles.
Keep Dashboards Simple for High Adoption
After ensuring the data is reliable, focus on creating a clean, easy-to-navigate dashboard. Simplicity encourages usage. Limit each view to 5–8 key metrics, placing the most important ones in the top-left corner where users naturally focus. Add benchmarks and historical data to provide context and make the information actionable.
Design dashboards with a layered structure, allowing managers to drill down from broad metrics, like regional performance, to specific deals. Ensure they are mobile-friendly with large touch targets for accessibility on the go. Teamgate CRM’s intuitive design and automation features support these best practices, helping teams maintain a clear and accurate pipeline without unnecessary complexity.
Conclusion
Creating role-based sales dashboards isn’t about adding bells and whistles – it’s about delivering actionable insights tailored to each team member’s needs. Sales reps need clear guidance on who to contact next and how they’re tracking toward their goals. Managers need a view of team performance and pipeline challenges. Executives need top-level insights to guide strategic decisions. When dashboards are designed to align with these roles, they naturally become tools that drive productivity and results.
Teamgate CRM makes this process straightforward by combining structure, clarity, and ease of use – eliminating unnecessary complexity. The system ensures every deal is in a real stage with a clear next step, helping you maintain a clean sales pipeline and reducing the chance of opportunities going stale. Automated follow-ups and reliable data build trust in the process. As Andrew Martin, CEO of Teamgate, puts it:
"The Teamgate dashboard helps you to keep track of staff performance, and helps you to significantly improve, and motivate your sales team".
To make dashboards effective, focus on a handful of key metrics, refine them based on user feedback, and ensure standardized data inputs for consistency. And don’t overlook speed – dashboards should load in under three seconds to keep up with the fast pace of sales. This approach can significantly streamline workflows and improve team performance.
FAQs
How do I choose the right 5–8 metrics for each role?
Focusing on key performance indicators (KPIs) tailored to each role ensures everyone stays aligned with their specific objectives.
- For sales reps: Track metrics like activity levels (calls, emails, meetings), deal progress through the pipeline, and conversion rates to measure their effectiveness and efficiency.
- For managers: Monitor pipeline health, forecast accuracy, and overall team performance to identify coaching opportunities and ensure goals are on track.
- For leaders: Use high-level KPIs such as total sales targets, revenue growth, and forecasted outcomes to guide strategic decisions.
Keep KPIs actionable and straightforward. Avoid overwhelming teams with excessive data – focus on clarity to enable quick, informed decision-making.
What data must reps keep updated for accurate dashboards?
Reps need to keep information current on deal status, activity history, emails, meetings, lead sources, and next steps. Accurate and up-to-date data ensures dashboards deliver reliable insights for monitoring sales performance and pipeline health.
How often should we review and change dashboard metrics?
Regularly reviewing and updating your dashboard metrics is essential to ensure they remain relevant and useful. A quick weekly review helps you keep an eye on key indicators, while a more in-depth monthly review allows for strategic adjustments. This habit keeps sales teams focused on their goals, spots trends early, and supports smarter, data-driven decisions.