Sales teams often struggle with stalled deals, unclear next steps, and unpredictable forecasts. Tracking sales productivity KPIs can solve these problems by showing how your current efforts impact future results. Metrics like win rates, sales cycle length, and pipeline coverage help you identify inefficiencies, improve performance, and make revenue more predictable.
Key Takeaways:
- KPIs are divided into leading indicators (predict future outcomes, like calls made) and lagging indicators (measure past results, like revenue).
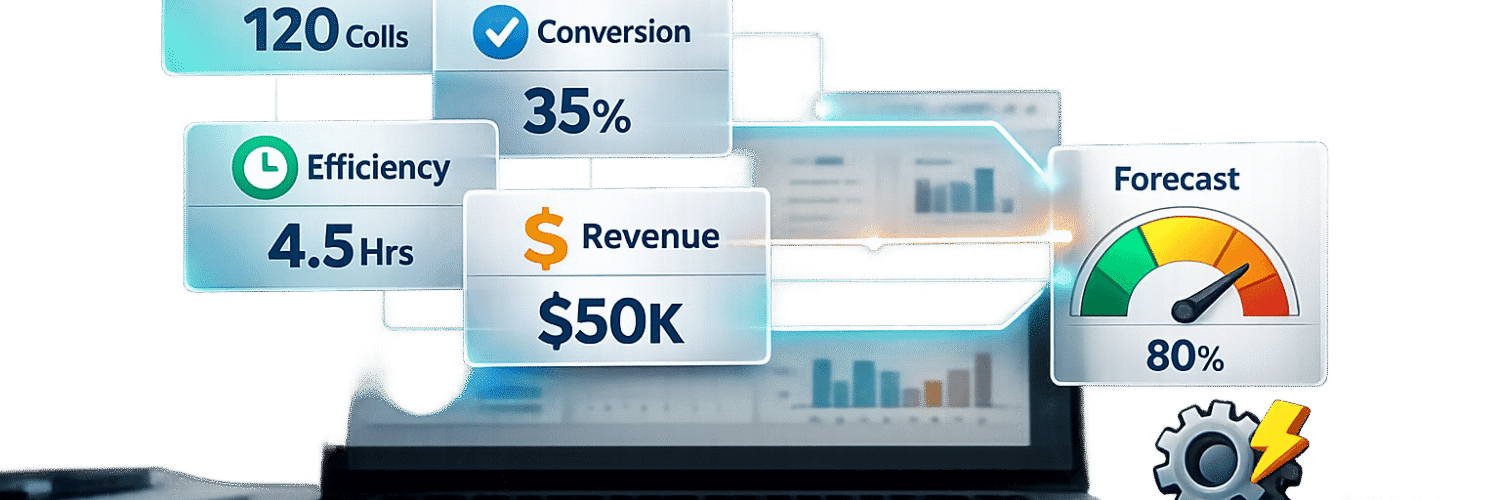
- Focus on four KPI categories: Activity, Conversion, Efficiency, and Revenue.
- Choose relevant, measurable, and actionable KPIs aligned with your goals.
- Use tools like Teamgate CRM to track metrics, reduce admin work, and maintain pipeline clarity. Teamgate helps reps follow a clear sales process while giving managers trustworthy insights – without unnecessary complexity.
How to Measure Sales Performance with Key Metrics and KPIs
sbb-itb-5772723
What Sales Productivity and KPIs Mean
4 Categories of Sales Productivity KPIs with Examples and Focus Areas
Sales productivity boils down to how effectively your team turns resources into revenue. It’s calculated as Sales Output ÷ Sales Input, where output includes things like revenue closed, qualified pipeline value, and high-quality opportunities created. Inputs, on the other hand, cover factors like sales headcount, hours spent on deal-related activities, software costs, and operating expenses.
This ratio tells you if your team is using resources efficiently or wasting them. For instance, a 5:1 ratio means $5 in revenue is generated for every $1 invested – a higher ratio reflects better efficiency in converting time and money into results.
KPIs (Key Performance Indicators) are the metrics that measure this productivity. They show how well your team is performing, as well as areas that need improvement. On average, sales professionals spend less than 30% of their time actually selling, with the rest of their time taken up by tasks like manual data entry, internal meetings, and administrative work. By tracking KPIs, you can pinpoint inefficiencies and refocus efforts on activities that drive results.
With this foundation in sales management, let’s dive deeper into the metrics that shape sales performance.
Sales Productivity Metrics Explained
To understand how activities lead to outcomes, sales productivity metrics are divided into two main types: leading indicators and lagging indicators.
- Leading indicators are forward-looking. They track current activities that influence future performance, such as the number of calls made, meetings booked, pipeline coverage, and lead response time. These metrics help guide your team’s daily actions and address potential problems before they escalate.
- Lagging indicators look backward. They measure outcomes that have already happened, like total revenue, profit margins, customer churn, and quota attainment. While these metrics confirm whether past strategies worked, they don’t provide early warnings about future challenges.
By balancing both types, you can see the full picture: leading indicators highlight what’s driving performance, while lagging indicators show what has been achieved.
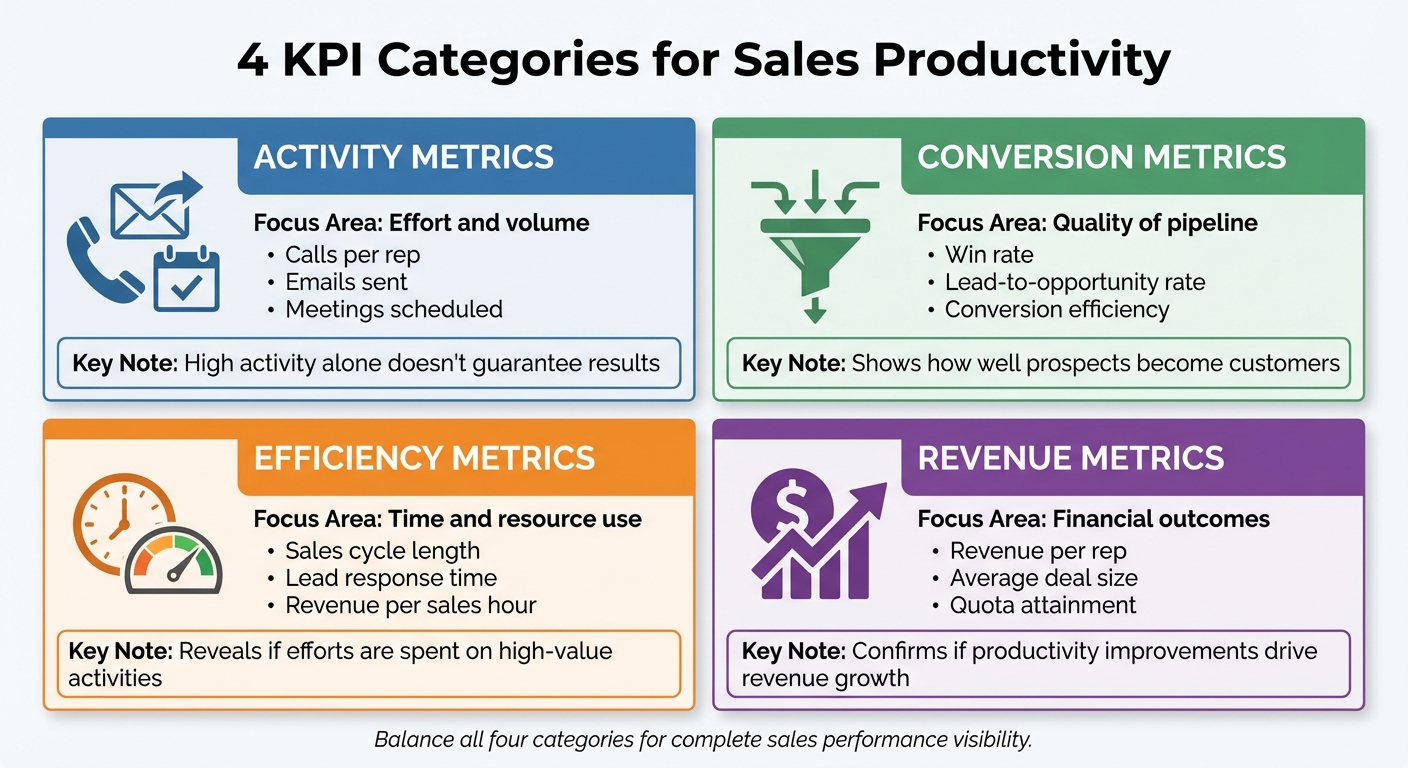
4 KPI Categories for Sales Productivity
KPIs can be grouped into four categories, each focusing on a different aspect of performance:
| KPI Category | Focus Area | Examples |
|---|---|---|
| Activity | Effort and volume | Calls per rep, emails sent, meetings scheduled |
| Conversion | Quality of pipeline | Win rate, lead-to-opportunity rate, conversion efficiency |
| Efficiency | Time and resource use | Sales cycle length, lead response time, revenue per sales hour |
| Revenue | Financial outcomes | Revenue per rep, average deal size, quota attainment |
- Activity metrics track the amount of work being done, like calls made or emails sent. While these metrics measure effort, high activity alone doesn’t guarantee results. For example, a rep could make 100 calls but close zero deals if their targeting or messaging is off.
- Conversion metrics focus on how effective that effort is. These include win rates and lead-to-opportunity conversion rates, which show how well your team turns prospects into paying customers. If activity is high but conversions are low, it might point to problems with qualification, messaging, or deal execution.
- Efficiency metrics measure how well your team uses its time and resources. Metrics like sales cycle length and lead response time reveal whether your team is moving deals through the pipeline quickly and responding to prospects promptly. Metrics like revenue per sales hour help identify whether efforts are being spent on high-value activities or wasted on low-impact tasks.
- Revenue metrics track financial performance. These include revenue per rep, average deal size, and quota attainment. They confirm whether improvements in productivity are translating into actual revenue growth.
How to Choose the Right KPIs for Your Sales Team
When selecting KPIs for your sales team, focus on metrics that align with your specific goals, processes, and resources. Not every metric is worth tracking – only choose those that are relevant, measurable, and actionable. A KPI is considered relevant if it ties directly to your business objectives, measurable if you have the tools to track it consistently, and actionable if your team can take steps to improve it. For instance, tracking "monthly calls per sales rep" checks all three boxes: it impacts pipeline generation, can be reliably monitored using tools like Teamgate CRM, and encourages reps to increase their efforts. On the other hand, a vague metric like "overall market conditions" fails these criteria, as it’s neither actionable nor directly tied to performance goals.
Match KPIs with Business Goals
Your KPIs should clearly connect your team’s daily activities to your broader company objectives. For example:
- If your main focus is revenue growth, prioritize metrics like monthly sales growth and new monthly recurring revenue (MRR).
- If efficiency is your goal, track metrics such as the average sales cycle length, cost per lead, and conversion rates at different funnel stages.
- For businesses focusing on profitability, KPIs like average profit margin and customer acquisition cost are critical.
Here’s a quick reference table to align KPIs with key objectives:
| Business Objective | Recommended KPIs | Indicator Type |
|---|---|---|
| Growth & Expansion | Sales Growth, Leads Generated, New Customers | Lagging |
| Operational Efficiency | Conversion Rate, Pipeline Velocity, Stage Durations | Leading/Lagging |
| Profitability | Profit Margin per Deal, Customer Lifetime Value (CLV) | Lagging |
| Team Productivity | Activities Completed, Calls/Meetings Scheduled | Leading |
Balance Leading and Lagging Indicators
To get a complete picture of your sales performance, use a mix of leading and lagging indicators. Leading indicators, like the number of calls or meetings scheduled, help predict future results and ensure steady effort. Lagging indicators, such as revenue growth or profit margins, show whether those efforts delivered the desired outcomes. If your team is hitting activity-based goals but not achieving results, it may signal inefficiencies in your process.
A balanced KPI strategy typically includes 5–8 core metrics. This combination provides a clear view of both the team’s current efforts and their long-term impact, helping you make informed decisions to improve overall performance. Teamgate can help streamline this process by providing real-time tracking and insights into your chosen metrics.
How to Set Up a System to Track and Analyze KPIs
To truly benefit from your chosen KPIs, you need a reliable system to track and analyze them. Without a solid setup, data becomes fragmented, updates lag, and your team ends up chasing numbers rather than closing deals. Here’s how to build a system that turns metrics into actionable insights.
Set Baselines and Benchmarks
Start by figuring out where your team stands today. Look at historical data from the past 3–6 months to calculate averages for each KPI. Use these averages to set realistic benchmarks that align with your business goals. For instance, if your average sales cycle length is 45 days, and you aim to reduce it by 20% over six months, your target becomes 36 days. Focus on gradual improvements rather than drastic changes to keep your team motivated and on track.
Track two types of metrics:
- Activity ratios: These measure how specific actions (like calls made) link to outcomes (like deals closed).
- Outcome metrics: These include results like revenue and win rates.
Once your benchmarks are defined, streamline data updates with automation tools to ensure accuracy and save time.
Use Tools to Automate KPI Tracking
Manual tracking eats up valuable selling time. Instead, use automation tools that capture data in real time as your team works. Automation ensures clean pipeline hygiene and more predictable outcomes.
Teamgate CRM simplifies this process by automatically logging activities like emails, calls, meetings, and next steps. This eliminates the need for reps to manually update fields. It also enforces pipeline discipline by requiring every deal to have a defined stage and next action, preventing opportunities from going stale. By integrating with tools like email platforms, calendars, and communication apps, Teamgate consolidates all your data in one place. When paired with clean data practices, AI-driven forecasting can boost revenue forecast accuracy to over 90%, turning your pipeline into a reliable planning tool rather than a guessing game.
Create Dashboards for Team Visibility
Dashboards make your data actionable by presenting it in a clear and accessible way. Build role-specific dashboards:
- Reps can track individual metrics and deal progress.
- Managers can monitor team performance and overall pipeline health.
Prioritize metrics that directly impact revenue, such as win rates, pipeline velocity, deal age, and next-step coverage. Avoid focusing on vanity metrics that look good but don’t drive results.
Use visual elements to identify trends and bottlenecks quickly. Keep dashboards simple and ensure they update automatically so your team always works with the latest information. This approach turns metrics into real-time insights, enabling focused coaching and better forecasting.
| Visualization Type | Best Use Case |
|---|---|
| Bar Charts | Comparing data across categories (e.g., rep performance) |
| Line Graphs | Showing trends and progress over time |
| Gauge Charts | Tracking progress toward numerical goals |
| Heat Maps | Identifying high and low activity areas in datasets |
How to Interpret and Act on KPI Data
Tracking KPIs is only the first step in improving performance. The real impact comes from interpreting this data and taking timely action. Here’s how to make the most of your KPI insights.
Find Bottlenecks and Opportunities
Start by analyzing your conversion rates and deal velocity. These metrics can highlight where deals are stalling or falling through. For example, if your proposal-to-close conversion rate dips below 25% or deals linger in the negotiation stage for over 30 days, it’s time to investigate the underlying issues.
Use won/lost reason tracking to uncover recurring patterns in deal outcomes. If a significant percentage of deals – say 40% – fail during the demo stage, it could signal that your product presentation isn’t connecting with prospects. Identifying whether deals are lost due to pricing, product fit, or timing gives you a clear direction for adjusting your strategy.
Additionally, examine how activity levels correlate with outcomes. If high-performing reps achieve a quote-to-close ratio of 30%, compared to the team average of 20%, their methods may offer valuable insights for the rest of the team. On the flip side, if reps are conducting numerous demos but few deals progress, it might indicate they’re focusing on unqualified leads.
Use KPIs for Coaching and Forecasting
KPI data is a powerful tool for both coaching and forecasting. Begin by comparing individual quota attainment to the team median. For instance, if the median quota attainment is 80% but some reps are at 15%, these discrepancies should guide your one-on-one coaching sessions.
Leading indicators like pipeline coverage (aim for 3–4× quota) and next-step coverage are essential for more accurate forecasting. Automated dashboards can help track these metrics. For example, when every deal in your pipeline has a defined next action within seven days, forecast reliability can exceed 90%. However, if pipeline coverage drops to 2× and deal age increases, it’s a sign to recalibrate your forecast and focus on high-velocity opportunities.
Teamgate CRM can simplify this process by automatically surfacing critical signals like deal age, activity levels, and next-step coverage. This ensures your coaching sessions are based on clear data rather than guesswork, enabling a more effective and evidence-driven approach.
Review and Refine Your Process
Regularly reviewing your KPIs is essential for maintaining a smooth sales process. Leading indicators should be reviewed weekly, while lagging indicators can be assessed monthly. If you notice trends like a 20% increase in sales cycle length or monthly growth falling below 5%, it’s critical to act quickly.
Compare your current metrics against established baselines to spot inefficiencies. For example, if reps are spending less than 70% of their time on selling tasks, consider ways to reduce their administrative workload. Testing improvements, such as refining qualification criteria or implementing automation, can result in productivity gains of 10–15% over time.
Automated alerts can also help you stay on top of bottlenecks. For instance, if deals remain without a next step for more than 10 days or stage durations exceed benchmarks, these alerts can prompt immediate action, preventing potential revenue loss.
Conclusion
Focus on tracking metrics that directly influence outcomes. Begin with a thoughtful balance of leading and lagging indicators to both guide actions and confirm results.
The real challenge lies not in gathering data but in transforming it into actionable insights. Break down metrics by factors like region, product line, or rep tenure to uncover obstacles and replicate what works. Use pipeline velocity calculations to monitor revenue movement, and track efficiency metrics to identify where administrative tasks are cutting into selling time.
For sustained success, prioritize three core elements: discipline, visibility, and adoption. Discipline ensures that every deal has a clear next step and consistent follow-up happens by design, not by accident. Visibility allows leaders to coach based on measurable signals – like deal age, activity levels, and next-step progress – rather than relying on guesswork. Adoption ensures the team actively engages with the system because it supports their selling efforts instead of adding unnecessary complexity. By focusing on these principles, KPI tracking becomes a tool for turning raw data into actionable strategies.
When paired with AI-driven sales forecasting and clean CRM practices, revenue forecast accuracy can exceed 90%. This level of precision depends on having reliable data. That’s why tools like Teamgate CRM emphasize eliminating "no next step" scenarios and flagging aging opportunities before they stall – transforming your pipeline into a true competitive edge.
Make it a habit to review KPI data regularly to identify and address trends as they emerge. This proactive approach keeps your strategy aligned with your goals.
FAQs
Which 5–8 sales KPIs should I track first?
To gauge sales productivity effectively, focus on tracking 5–8 key KPIs that represent your team’s overall performance. These might include sales revenue, growth rate, customer retention, churn rate, lead conversion rate, and sales cycle length. You can also monitor metrics like customer lifetime value (CLV) and deal velocity to pinpoint bottlenecks and refine your processes. Make sure the KPIs you select align with your specific objectives, and leverage tools like CRM systems to regularly monitor and analyze these metrics for actionable insights.
How do I set KPI baselines and targets from past data?
To establish KPI baselines and set achievable targets, start by examining historical sales data. Look for key metrics such as average deal velocity and overall pipeline health. These figures will help you create realistic benchmarks and monitor trends over time.
With baselines in place, set targets that reflect past performance while pushing for steady improvement. Grounding your KPIs in real data ensures more accurate forecasting and helps you effectively manage and enhance sales performance.
How can Teamgate CRM reduce admin time while keeping pipeline data accurate?
Teamgate CRM reduces the time spent on administrative tasks by automating data entry, monitoring sales activities, and maintaining a clean pipeline. This ensures your data stays accurate and current with minimal manual input, so your team can dedicate more time to selling rather than managing tedious admin work.