
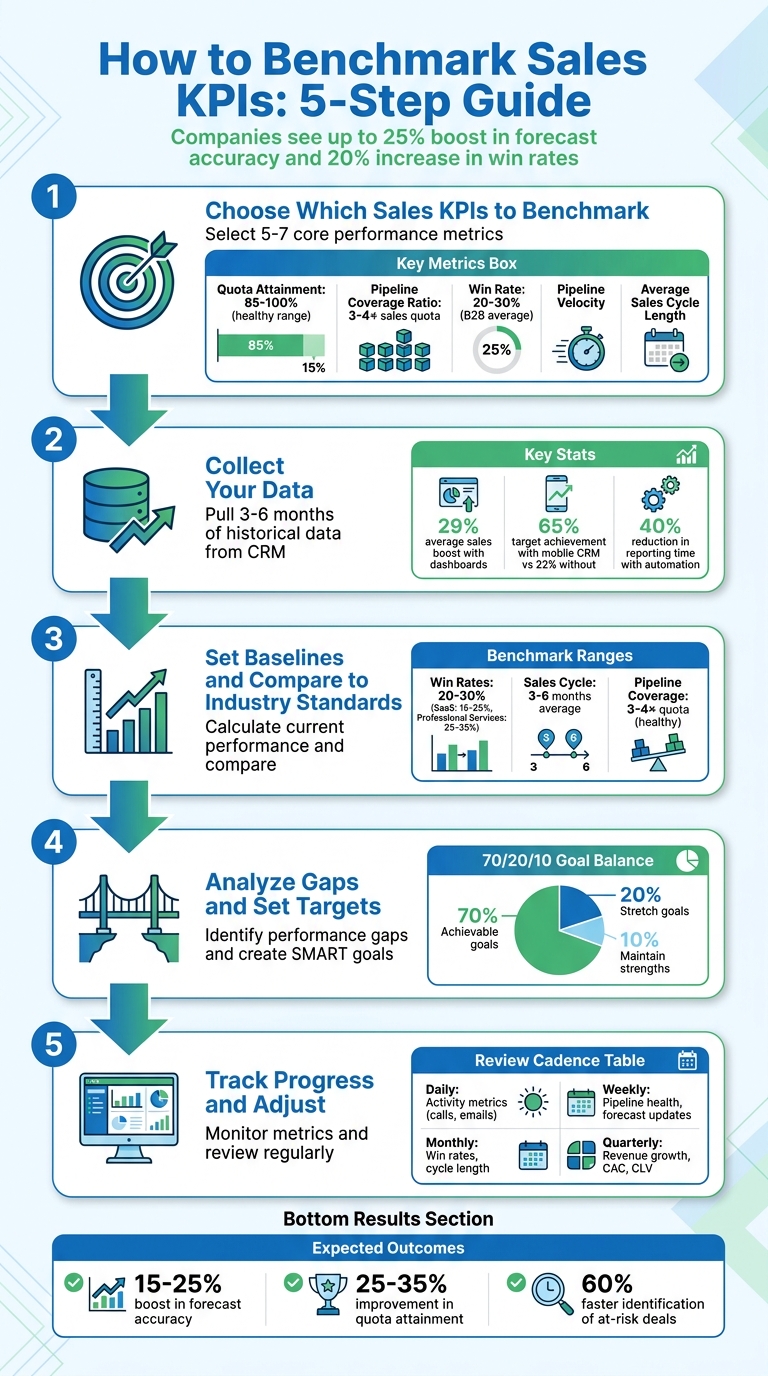
Most sales reps fail to meet their quotas because they’re tracking the wrong metrics or lack clear benchmarks. Without these, teams are left guessing about pipeline health, activity effectiveness, or forecast accuracy. Benchmarking your KPIs solves this by turning raw data into actionable insights – helping you identify bottlenecks, coach reps effectively, and align activities with revenue goals. Companies that do this well see up to a 25% boost in forecast accuracy and a 20% increase in win rates.
Here’s how to start:
- Choose key KPIs: Focus on 5–7 metrics like quota attainment, win rate, and pipeline velocity.
- Gather clean data: Use tools like Teamgate to pull 6–12 months of historical data and segment by role or deal size.
- Set baselines: Calculate your current performance and compare it to industry standards.
- Analyze performance gaps: Identify where you’re falling short and create clear, measurable targets.
- Track and adjust: Use Sales KPI dashboards to monitor progress and refine strategies regularly.
Teamgate helps sales teams follow a clear process and provides managers with trustworthy pipeline insights – without turning CRM into a time-consuming task. By focusing on the right metrics and maintaining clean, structured data, you can build a predictable and reliable revenue engine.
5-Step Sales KPI Benchmarking Process with Key Metrics
Step 1: Choose Which Sales KPIs to Benchmark
Select Your Core Performance Metrics
To avoid overwhelming your analysis, focus on 5–7 key KPIs that directly influence revenue instead of trying to track too many metrics at once.
Start with the “Starter Five” KPIs: Quota Attainment, Pipeline Coverage Ratio, Win Rate, Pipeline Velocity, and Average Sales Cycle Length. Here’s what they reveal:
- Quota Attainment: Tracks whether sales reps are hitting their targets. A healthy range is between 85–100%.
- Pipeline Coverage Ratio: Shows if your funnel has enough opportunities. A good benchmark is 3–4× your sales quota.
- Win Rate: Measures how effectively leads convert into closed deals. For B2B teams, this typically falls between 20–30%.
It’s also important to balance leading indicators (like meetings booked or pipeline created) with lagging indicators (such as closed revenue or win rate). Leading metrics provide immediate feedback, while lagging ones confirm long-term trends.
Tailor KPIs to your team’s roles. For example:
- SDRs (Sales Development Representatives): Focus on early-stage metrics like meetings booked.
- Account Executives: Prioritize closed revenue and deal size.
- Account Managers: Emphasize retention and account growth.
Different industries and sales cycles also demand different benchmarks. For instance, a manufacturing rep closing $100K deals over 6–12 months will track different metrics than a SaaS rep managing $15K contracts over 1–3 months.
Connect KPIs to Revenue Goals
Every KPI should tie directly to a business goal. If your objective is market expansion, track metrics like new territory performance. If profitability is the focus, emphasize efficiency metrics and average deal size.
Work backward from your revenue target to set clear benchmarks. For example, if your goal is $5M in annual recurring revenue, and your historical win rate is 25% with an average deal size of $50K, you can calculate how many qualified opportunities your pipeline needs.
“KPIs bridge your business objectives with where you currently stand, relating sales performance to your core goals over set increments of time.” – Faiza Hughell, Senior Vice President, Small Business, RingCentral
Convert broad goals into measurable targets. For instance, instead of saying “Grow revenue”, define it as “Increase annual revenue by 15% for our top-performing product by December 31, 2026”. Standardize KPI definitions across departments to ensure consistency. For example, when marketing, sales, and finance agree on what constitutes a “qualified lead”, sales forecasting becomes more accurate and actionable.
sbb-itb-5772723
Step 2: Collect Your Data
Pull Data from Teamgate CRM
To benchmark effectively, you need accurate and reliable data. Start by pulling historical performance metrics from Teamgate’s sales dashboards, which provide real-time insights into both team and individual performance metrics. Aim to gather 3–6 months of historical data for each key performance indicator (KPI) to identify meaningful trends.
Leverage Teamgate’s activity tracking to capture both leading indicators (like calls made, emails sent, and meetings scheduled) and lagging indicators (such as closed deals and win rates). Research shows that organizations using sales dashboards experience, on average, a 29% boost in sales. Make sure CRM records are up-to-date to ensure data accuracy.
Break down your data collection by role for better clarity:
- Account Executives: Focus on quota attainment and closed revenue.
- SDRs (Sales Development Representatives): Track meetings booked and pipeline created.
- Account Managers: Monitor retention rates and account growth.
Teamgate’s pipeline insights can also help you refine your forecasts using weighted deal values (calculated as Deal Value × Probability %). Additionally, include activity data from all devices – teams using mobile CRM tools achieve targets at a 65% rate compared to just 22% for teams without mobile access.
Automating KPI tracking can save time and improve accuracy. Automated systems reduce reporting time by 40%, improve forecast accuracy by up to 25%, and boost quota attainment by as much as 35%. Use Teamgate’s built-in reporting tools or set up automated exports to minimize manual errors and streamline your workflow.
Organize Data for Analysis
Once your data is collected, organize it for easy analysis and comparison. Export reports as CSV files from Teamgate to work with external tools or spreadsheets. Group your metrics into the following categories:
- Core Revenue: Metrics like win rate and average selling price.
- Pipeline Health: Metrics such as coverage ratio and velocity.
- Efficiency: Includes sales cycle length and lead response time.
- Activity: Tracks calls, demos, and emails.
Segment your data by rep, team, product line, or lead source to uncover specific strengths and bottlenecks. For instance, if your team’s overall win rate is 22% but one rep consistently closes at 35%, segmentation can help pinpoint successful strategies. Tailor data views based on the audience: reps benefit from personal activity metrics, managers need team-level insights, and executives focus on high-level revenue and growth trends.
To ensure consistency and accuracy, standardize naming conventions and define metrics clearly across all systems. Document how each KPI is calculated and note the data sources to avoid confusion. As Improvado highlights:
“Sales metrics only drive performance when they are accurate, timely, and consistently defined across systems”.
Finally, implement automated data quality checks to identify anomalies before they distort your analysis. Teams that maintain well-structured data can spot at-risk deals 60% faster, allowing them to take action before opportunities slip away.
Step 3: Set Baselines and Compare to Industry Standards
Calculate Your Current Baselines
Start by analyzing 6–12 months of historical data to establish performance baselines. This involves using measurable data to quantify outcomes for the KPIs you identified in Step 1. For instance, if your team closed 45 deals out of 200 opportunities in the past six months, your baseline win rate is 22.5%.
Key baseline calculations include:
- Average win rate = total deals won ÷ total opportunities
- Sales cycle length = average days from first contact to close
- Pipeline coverage ratio = total pipeline value ÷ sales quota
- Quota attainment = actual revenue ÷ assigned quota
Segment your data by individual reps, teams, or deal sizes to uncover performance variations. For example, you might find that smaller deals (under $50,000) close in 45 days, while larger deals (over $100,000) take 180 days. This segmentation provides valuable insights for forecasting and allocating resources effectively. historical data not only highlights areas for improvement but also helps refine your sales management strategies over time.
With tools like Teamgate’s reporting dashboards, you can automate these calculations and ensure consistency by documenting your methodology and the date ranges used. These baselines are essential for comparing your performance to industry standards.
Find Industry Benchmark Data
Once you’ve calculated your internal metrics, compare them to industry benchmarks to understand your competitive position. Look for industry reports, whitepapers, or vendor research that provide KPI benchmarks specific to your industry (e.g., SaaS, manufacturing, or professional services) and deal size, as these factors significantly affect performance expectations.
For reference, industry benchmarks suggest:
- Win rates: Typically range from 20–30%, with SaaS companies averaging 15–25% and top performers reaching 30% or more. Professional services firms often see win rates of 25–35%, with top performers achieving 40% or higher.
- Sales cycle lengths: Commonly 3–6 months, though deals between $10,000 and $50,000 may close in 1–3 months, while deals over $500,000 can take 12–18 months.
- Pipeline coverage ratios: A healthy range is 3–4 times the sales quota.
When comparing benchmarks, ensure you’re aligning similar deal sizes – don’t measure a $250,000 enterprise deal against a $25,000 mid-market transaction. Balance your analysis by including both leading indicators (like meetings booked) that predict future outcomes and lagging indicators (like win rate) that reflect past performance.
If your business lacks historical data, starting with these industry averages provides a practical foundation for setting realistic performance targets. Tools like Teamgate can simplify this process by offering clarity, structure, and reliable pipeline insights, helping you stay focused on disciplined selling and actionable data.
Step 4: Analyze Gaps and Set Targets
Identify Performance Gaps
Once you’ve established your baselines and reviewed industry data in Step 3, it’s time to pinpoint where your performance is falling short – or exceeding expectations. Compare your team’s metrics directly to industry benchmarks. For instance, if your win rate is 18% but the industry average for your sector is 25%, you’ve uncovered a 7-percentage-point gap that could be costing you significant revenue.
Dive deeper by segmenting your analysis based on factors like deal size, territory, or the experience level of your reps. This approach can uncover specific weaknesses. For example, you might find that your team converts 30% of deals under $50,000 but only 12% of deals over $100,000. This suggests a need to focus on enterprise selling skills rather than general sales ability. Watch for warning signs, such as pipeline coverage falling below 3x quota, which signals the need for immediate action to stay on track.
It’s also crucial to verify the accuracy of your data. Gaps should reflect true performance, not outdated or incomplete records. Teamgate helps ensure your data stays reliable by keeping deal stages updated and next steps clearly defined. With an accurate understanding of your performance gaps, you can confidently move on to setting precise improvement targets.
### Create SMART Goals
Transform each identified gap into a Specific, Measurable, Achievable, Relevant, and Time-bound goal. Avoid vague objectives like “improve pipeline coverage” and aim for something clear and actionable, such as: “Increase pipeline coverage from 2.5x to 3.5x quota by September 30, 2026, by adding 15 qualified opportunities per rep each month.” This kind of clarity makes it easier to track progress and stay focused.
For every gap, outline a SMART target that includes the metric, target value, data source, review frequency, and the person responsible for achieving it. Use the 70/20/10 framework to balance your goals: 70% should be challenging but achievable, 20% should stretch your team, and 10% should focus on maintaining strengths. This mix keeps your team motivated without overwhelming them.
For example, if your sales cycle for deals between $50,000–$100,000 is 5.5 months while the industry average is 4 months, set a goal to reduce it to 4.5 months within six months. You could achieve this by improving qualification criteria and automating follow-up reminders. Assign a sales manager to oversee this KPI, track weekly progress using Teamgate, and document the initiatives – like enhanced training on objection handling or a revamped discovery call framework – that will help achieve the goal. Be prepared to adjust targets as conditions evolve.
Step 5: Track Progress and Adjust
Monitor Performance in Teamgate Dashboards
After setting your SMART goals, it’s critical to keep an eye on your metrics and address any issues as they arise. Teamgate’s dashboards are designed to highlight key indicators that predict revenue, such as deal age, activity levels, and next-step coverage. This ensures you’re always informed between reviews, rather than operating in the dark.
Tailor the dashboard views based on roles to streamline focus:
- Reps: Track daily activities like calls, emails, and meetings, along with real-time quota progress.
- Managers: Monitor team performance, pipeline health, and risk alerts, such as deals stalling or opportunities without clear next steps.
- Executives: Keep an eye on revenue growth, customer acquisition costs, and forecast accuracy.
Organizations that utilize effective sales dashboards report an average 29% increase in sales, thanks to delivering the right data to the right people at the right time.
Keep an eye on deal slippage – the percentage of deals missing their original close dates – using Teamgate. If more than 20% of forecasted deals are slipping, it could indicate problems with qualification or overly optimistic forecasting. Similarly, tracking how long deals spend in each stage can reveal bottlenecks. For example, if deals linger in one stage longer than expected, it pinpoints where coaching is needed most. Metrics like these, which you can actively manage, are known as leading indicators. Use them to guide your reviews and pivot strategies as necessary.
Review and Adjust Regularly
Benchmarking isn’t a one-and-done task – it’s a continuous process. Regular tracking should align with a structured review cadence. Consider a tiered approach:
- Daily: Focus on activity metrics like calls, emails, and lead response times to maintain consistency.
- Weekly: Assess pipeline health, forecast updates, and team performance to spot at-risk deals and short-term gaps.
- Monthly: Dive into win rates, sales cycle length, and stage-by-stage conversion rates to refine processes and coaching.
- Quarterly: Evaluate strategic KPIs like revenue growth, customer acquisition cost, customer lifetime value (CLV), and team turnover to make broader strategic adjustments.
| Review Frequency | Focus Metrics | Primary Goal |
|---|---|---|
| Daily | Calls, emails, lead response time | Maintain activity consistency |
| Weekly | Pipeline health, forecast updates, team performance | Identify at-risk deals and short-term gaps |
| Monthly | Win rates, cycle length, conversion by stage | Optimize processes and coaching |
| Quarterly | Revenue growth, customer acquisition cost, CLV, team turnover | Adjust strategy and targets |
During weekly pipeline reviews, dig deeper into the numbers to understand the context. For instance, if win rates are unusually high but overall pipeline coverage is low, it might signal the team is focusing only on easier deals. Similarly, if the sales cycle is shortening but average deal size is shrinking, it could mean faster closes are coming at the cost of larger opportunities. As Jerry Muller wisely notes, “Measurement should inform judgment, not replace it”. Use your data to ask smarter questions and adapt your strategy.
Sales KPIs The 12 Key Sales Metrics You Should Be Tracking
Conclusion
Benchmarking sales KPIs is the cornerstone of driving predictable revenue growth. By focusing on the right metrics, ensuring clean data, setting achievable baselines, identifying performance gaps, and consistently tracking progress, you can shift from reactive problem-solving to proactive sales management. Companies that embrace disciplined KPI tracking often experience a 15–25% boost in forecast accuracy and a 25–35% improvement in quota attainment. The key is maintaining discipline and focusing on metrics that truly matter.
The real challenge lies in maintaining sales pipeline hygiene and ensuring every metric reflects actionable insights. As Dmytro Chervonyi, CMO at Forecastio, explains:
“Effective B2B sales KPI tracking is not just about collecting data – it’s about creating a culture of accountability, continuous improvement, and data-driven decision making”.
To achieve this, you need tools that enforce disciplined selling practices. Teamgate CRM is designed to do just that. It ensures every deal is assigned a stage and a clear next step, so opportunities don’t linger unnoticed. Automation keeps follow-ups consistent, allowing reps to spend less time on admin tasks and more time advancing deals. Managers gain actionable insights – like deal age, activity levels, and next-step coverage – so they can coach effectively and rely on a pipeline built on real data.
The outcome? A reliable, evidence-based pipeline that drives steady growth. Teamgate doesn’t just track revenue – it protects it by addressing the hidden costs of inactivity. When your sales strategy is grounded in pipeline accuracy instead of guesswork, you can finally trust your data to guide your decisions.
FAQs
How do I pick the right 5–7 sales KPIs?
To select the best 5–7 sales KPIs, prioritize metrics that directly support your strategic objectives and offer clear insights into performance. Examples of such KPIs include revenue growth, conversion rate, average deal size, sales cycle length, and customer acquisition cost.
Keep your KPIs limited to maintain focus and avoid confusion. Build them on accurate historical data to ensure they reflect actionable areas that can drive revenue and support long-term success.
What if my CRM data is incomplete or messy?
Incomplete or disorganized CRM data can throw off your ability to track KPIs and analyze sales effectively. To address this, start by cleaning up your data: remove duplicate entries, update outdated records, and make sure every deal and activity includes clear next steps. Set up structured data entry practices, such as consistently using predefined fields and statuses, to keep your CRM data reliable over time. This approach leads to smarter decisions, better coaching opportunities, and a dependable sales pipeline.
How often should I update KPI benchmarks and targets?
Keeping your KPI benchmarks and targets up-to-date is essential to ensure they align with your business objectives. Many sales teams find it effective to review KPIs on a monthly basis, though some may track specific metrics weekly, depending on the speed of their operations and the nature of the KPIs. Regular updates help you stay responsive to shifts in the industry and changing customer expectations.