
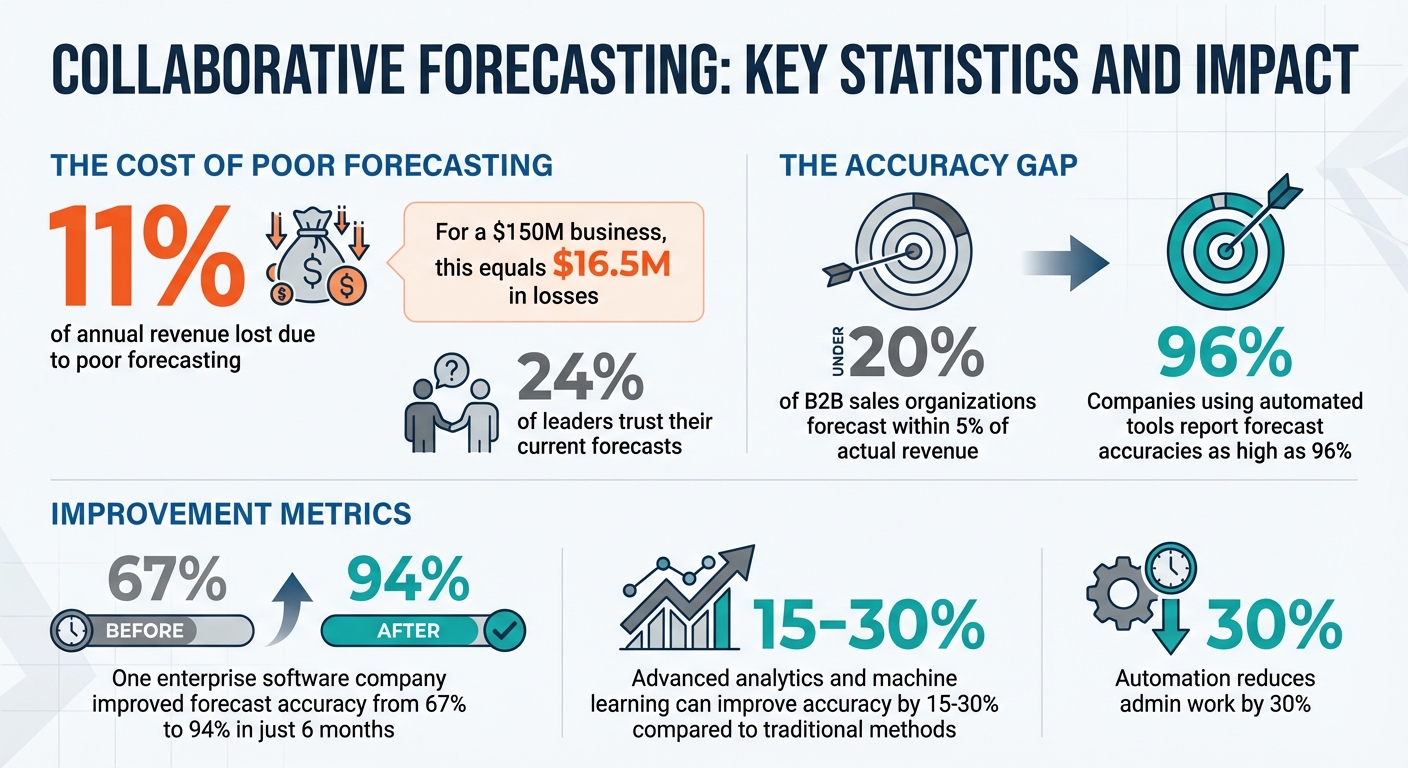
Collaborative forecasting transforms revenue predictions by combining insights from sales reps, managers, and executives. It replaces outdated, intuition-driven methods with data-backed, transparent processes. Why does this matter? Poor forecasting can cost companies up to 11% of annual revenue – equivalent to $16.5M for a $150M business. Yet, only 24% of leaders trust their current forecasts.
Key takeaways for accurate forecasting:
- Use clean data: Regularly audit CRM entries to avoid inflated pipeline values.
- Establish clear roles: Define responsibilities for sales reps, managers, and leadership to ensure accountability.
- Automate updates: Sync CRM with email and calendars to reduce manual errors.
- Standardize pipeline stages and sales processes: Base progress on buyer actions, not seller tasks, with clear entry and exit criteria.
- Track metrics: Metrics like forecast bias and stage velocity help refine predictions and improve accuracy.
Companies using automated tools report forecast accuracies as high as 96%. Teamgate supports this approach by ensuring a disciplined sales process, reliable pipelines, and high user adoption – without the complexity of bloated enterprise CRMs. With these steps, you can create forecasts that drive confident decision-making and protect revenue.
Collaborative Forecasting Statistics and Impact on Revenue Accuracy
Sales Forecasting Essentials: Methods, Tools, and Best Practices
Choosing the right sales forecasting software is a critical first step in establishing these essentials.
sbb-itb-5772723
Core Principles of Collaborative Forecasting
Successful collaborative forecasting relies on three key principles: clean data, clear accountability, and continuous updates. Without these, even the most advanced tools won’t deliver reliable results. For sales and finance teams to work effectively, they must agree on consistent definitions for terms like "booked revenue" and "recognized revenue", creating a unified source of truth. When departments interpret these metrics differently, forecasts become fragmented and unreliable.
Accountability is crucial, and a tiered review process can help enforce it. For instance, one enterprise software company improved its forecast accuracy from 67% to 94% in just six months by adopting tiered reviews and prioritizing data quality. This process involves individual reps reviewing deals with their managers, managers consolidating insights with department heads, and leadership ensuring that final figures align with business goals. Each level questions assumptions, reducing the risk of overly optimistic projections.
Viewing forecast variances as learning opportunities rather than failures is equally important. TimeTackle’s editorial staff explains:
"A forecast variance isn’t a mistake to be punished; it’s a signal that one of your underlying assumptions was incorrect."
This approach fosters honest reporting and discourages practices like sandbagging. Conducting regular variance analyses – comparing forecasts to actual outcomes – helps identify flawed assumptions and refine future forecasting cycles. These principles lay the groundwork for the practical steps that follow.
Maintaining Clean and Reliable Data
Accurate forecasting starts with clean pipeline data. Regularly auditing your CRM for "stale" deals – such as opportunities stuck in the "Negotiation" stage for too long – can prevent inflated pipeline values and false confidence. Automating activity capture reduces admin work by 30% while ensuring consistent logging of customer interactions.
Involving multiple stakeholders in each deal also increases data accuracy. Additionally, establishing clear entry and exit criteria for every pipeline stage eliminates ambiguity, ensuring deals only move forward when specific buyer actions are completed.
Defining Roles and Responsibilities
Clear roles are essential for maintaining forecast accuracy. A structured forecast hierarchy – from sales reps to leadership – ensures that forecasts reflect collective judgment rather than isolated guesses. Each role has defined responsibilities that contribute to overall accuracy:
| Role | Responsibility in Forecasting | Impact on Accuracy |
|---|---|---|
| Sales Representative | Entering accurate data, maintaining deal stages, and logging activities | Provides a solid pipeline foundation |
| Sales Manager | Reviewing reps’ data, adjusting forecasts, and coaching the team | Filters out individual biases |
| Sales Leadership | Consolidating forecasts and aligning them with company goals | Offers a strategic, high-level perspective |
| Sales Ops/Finance | Setting quotas and maintaining systems and definitions | Ensures data consistency and technical integrity |
As Gong emphasizes:
"As a frontline manager, you’re responsible for the accuracy of your forecast."
Defining roles not only ensures accountability but also supports the actionable improvements discussed later.
Regular Updates and Forecast Adjustments
With clear roles and clean data in place, regular updates keep forecasts accurate. Establishing a fixed schedule – weekly or monthly – helps integrate forecasting into daily operations. Companies using automated activity capture and signal-based tools have reported forecast accuracy as high as 96%.
Real-time dashboards can replace manual spreadsheets, making forecasts accessible to all stakeholders. Integrating your CRM with calendars and inboxes automates the logging of meetings and emails, reducing inconsistencies in manual data entry. Advanced analytics and machine learning can further enhance accuracy by 15% to 30% compared to traditional methods.
The aim isn’t perfection from the start. As TimeTackle’s editorial staff notes:
"The goal isn’t just to predict the future; it’s to create a system so reliable that it helps shape a more predictable future."
Best Practices for Improving Forecast Accuracy
Improving forecast accuracy isn’t just about avoiding revenue loss – it’s about building trust in your sales process. Outdated methods often lead to unreliable forecasts and missed opportunities. By focusing on operational discipline – clear pipeline stages, automated tracking, and data-driven decisions – you can create forecasts that truly guide your business.
Standardizing Pipeline Stages and Next Steps
The first step to accurate forecasts is redefining pipeline stages to reflect buyer actions, not seller tasks. Instead of using internal milestones like "Demo Done" or "Proposal Sent", align stages with buyer behavior, such as "Buyer engaged economic decision-maker" or "Buyer validated solution with technical team". This approach eliminates ambiguity and prevents deals from lingering in stages like "Negotiation" without progress.
Each stage should have clear, objective entry and exit criteria. For example, a deal should only move to "Commit" when specific conditions are met, such as receiving written confirmation from the buyer or scheduling an implementation kickoff. Without these criteria, forecasts risk being inflated by overly optimistic deals.
Assign probability percentages to each stage based on historical data rather than gut instincts. For instance, if 50% of deals in "Proposal" close, use that number consistently for weighted forecasts. Similarly, apply historical conversion rates to stages like "Negotiation" to remove bias and ensure accuracy.
Set time limits for each stage to flag deals that are becoming "stale." For example, a deal stuck in "Proposal" for over 45 days might signal issues like a disengaged buyer or shifting priorities. Identifying these at-risk deals early allows managers to step in, coach reps, or shift focus to healthier opportunities before the quarter ends.
Once stages are standardized, the next step is automating updates to ensure no critical action is overlooked.
Using Activity Tracking and Automations
Manual data entry is a common weak point in forecasting. Reps might forget to log calls, lose track of meetings, or misplace important email threads, leaving managers with incomplete information. Automating activity capture solves this by syncing emails, calls, and meetings directly from tools like Gmail, Outlook, and calendars into your CRM. This creates a real-time, accurate record of deal activity.
Automation also highlights deal health signals that manual updates might miss. For instance, a deal marked as "Commit" is meaningless if the buyer hasn’t responded in two weeks. Automated alerts can flag such stalled deals, enabling timely intervention. Similarly, tracking whether a rep is "multi-threaded" – engaging multiple decision-makers – helps reveal whether the deal has organizational buy-in or is at risk if a single stakeholder drops out.
Automated reminders and follow-ups ensure that reps don’t forget to re-engage with prospects. This proactive approach reduces the loss of opportunities caused by delayed follow-ups or forgotten tasks, addressing what is often referred to as a "silent revenue leak."
By reducing administrative burdens, automation allows reps to focus on selling. More importantly, using behavioral data instead of subjective updates has helped some organizations achieve forecast accuracy rates as high as 96%.
Making Data-Driven Decisions
Beyond automation, improving forecasts requires a commitment to learning from your data. Start with variance analysis – compare past forecasts to actual results to identify inaccurate assumptions. For example, if deals in "Proposal" consistently underperform, your entry criteria for that stage may need tightening. Similarly, if "Commit" deals frequently fall through, you might be missing a key buyer approval step.
As TimeTackle’s editorial team notes:
"A forecast variance isn’t a mistake to be punished; it’s a signal that one of your underlying assumptions was incorrect."
This mindset encourages honest reporting and reduces the temptation to "sandbag" numbers. Back-testing your current model against historical data can also uncover hidden biases. Use past quarters to "predict" results with your current stage criteria and probabilities, then compare those predictions to actual outcomes. If your model misses the mark, adjust definitions, probabilities, or time limits until your forecasts align with reality.
Track leading indicators like deal age, activity frequency, and next-step coverage to catch at-risk deals early. For example, a deal in "Negotiation" with no activity in 10 days, no scheduled follow-up, and only one engaged contact is a red flag – even if the rep marks it as "Commit." Acting on these signals allows managers to step in and either save the deal or redirect resources effectively.
While advanced analytics and machine learning can further improve forecast accuracy by up to 30%, the foundation lies in clean data, consistent definitions, and objective criteria. These basics transform your pipeline into a reliable tool for predicting future revenue.
Key Metrics to Measure Forecast Accuracy
The right metrics can shine a light on where your sales forecasting process needs improvement. Are your estimates overly optimistic? Are deals stalling at certain stages? Are your stage definitions misaligned with how deals actually progress? Tracking these metrics by individual contributor and over specific time periods turns vague notions of "accuracy" into actionable insights you can address through coaching and process adjustments.
Shared frameworks for measurement also help teams work together more effectively and refine forecasts in real time.
Understanding Forecast Accuracy Metrics
Here are some key metrics to evaluate and improve forecast accuracy:
- Mean Absolute Percentage Error (MAPE): This widely used metric calculates the average percentage error between forecasted and actual results. It’s particularly useful for comparing performance across teams or time periods. For instance, a MAPE of 15% means your forecasts are off by an average of 15%.
- Weighted Mean Absolute Percentage Error (WMAPE): A variation of MAPE that better handles zero-demand scenarios and irregular patterns.
- Forecast Bias: This metric reveals whether your team tends to over-forecast (positive bias) or under-forecast (negative bias) consistently.
- Stage Velocity: This measures how long deals spend in each stage compared to historical averages. For example, if a typical deal closes in 90 days but one is still open after 110 days, that’s a warning sign.
Modern forecasting tools also analyze behavioral signals – like the number of stakeholders involved, attendance at key meetings, and engagement with pricing documents – to provide objective indicators of deal health.
Tracking Metrics by Contributor and Time Period
Breaking down forecast accuracy by individual contributor can reveal patterns that overall numbers might hide. For example, one rep might overestimate deals in the "Proposal" stage, while another might be overly cautious during "Negotiation." Identifying these trends allows for tailored coaching instead of generic training sessions.
Tracking metrics over time – whether weekly or monthly – can help you spot issues like "late-stage slippage" or "pipeline bloat" before they derail your quarterly goals. This time-based tracking also provides valuable insights for other departments, such as finance (budgeting), HR (hiring), and customer success (onboarding). Regularly scheduled forecast reviews ensure updates are routine and not rushed at the last minute.
Using Metrics to Improve Performance
Forecast metrics should be tools for improvement, not just performance trackers. Segmenting results by contributor can highlight team members with consistently high error rates, enabling targeted coaching. If deals frequently exceed average stage durations, set up stall alerts to flag them as at-risk and adjust their closing probabilities.
Variance analysis can also help refine your process. Compare forecasted outcomes to actual results, then adjust stage entry criteria or probabilities if trends show consistent underperformance. Back-testing your current model against historical data can uncover hidden biases. For example, use past quarters to "predict" outcomes using current criteria, then refine your approach until forecasts align better with reality. Additionally, account for historical forecast errors when planning future inventory or resource needs.
The reality is stark: fewer than 20% of B2B sales organizations forecast within 5% of actual revenue. However, companies using automated activity capture and signal-based intelligence have achieved accuracy rates as high as 96%. Clean data, consistent stage definitions, and timely metrics are the cornerstones of a forecasting system that truly reflects your sales performance.
How Teamgate CRM Supports Collaborative Forecasting
Collaborative forecasting only works when your pipeline reflects reality, not wishful thinking. Teamgate CRM is designed around three core principles: disciplined selling, a reliable pipeline, and high adoption by sales reps. Instead of being just a passive database, Teamgate actively ensures clean data and consistent follow-ups. This makes revenue predictions more accurate by grounding them in real-time, objective data.
Pipeline Management for Clean Data
Accurate forecasting starts with clean and consistent data. Teamgate CRM enhances pipeline management through its Visual Deal Pipeline, which uses structured stages with clear entry and exit criteria. This eliminates confusion caused by inconsistent labeling, such as one rep calling a deal "Proposal" while another labels it "Negotiation." With standardized criteria, everyone on the team categorizes deals the same way, ensuring consistency across the board.
To further refine accuracy, Teamgate uses automated lead scoring based on your Ideal Customer Profile (ICP). This removes emotional bias and keeps the focus on high-probability deals, avoiding pipeline clutter from unrealistic opportunities. Manual data entry, often prone to errors, is minimized through automated data capture, ensuring information is recorded accurately and in real time. This leads to consistent probability weighting across the pipeline, resulting in forecasts you can rely on.
Activity and Task Automation
Capturing every sales interaction is just as important. Teamgate automates tasks, reminders, and follow-ups to ensure consistent engagement, preventing deals from going stale. Real-time tracking of activities – like calls, emails, and meetings – means your forecast reflects actual sales efforts, not outdated manual updates.
The system also flags at-risk deals by identifying opportunities that exceed the average stage duration based on historical data. These alerts allow teams to adjust closing probabilities before it’s too late. With advanced analytics and machine learning, this approach can improve forecast accuracy by 15–30% compared to traditional manual methods.
Real-Time Dashboards and Reporting
Teamgate’s real-time dashboards provide instant visibility into key metrics like deal age, activity levels, and next-step coverage. Managers can use these insights to make proactive adjustments before deals stall. The Visual Sales Funnel Analysis shows exactly how prospects move through each stage, highlighting conversion rates and pinpointing where deals are getting stuck.
Sales velocity metrics further enhance decision-making by measuring how quickly leads, deals, and revenue progress. This allows teams to adjust strategies in real time to meet their forecasted goals. Instead of waiting until the end of the month to discover forecasting errors, Teamgate enables data-driven pipeline reviews throughout the quarter. By focusing on at-risk deals early, your team can stay on track. With dashboards that require no setup, these insights are easily accessible to everyone on the team.
Conclusion
Collaborative forecasting creates a structured approach that transforms revenue prediction into a reliable process. The core principles are simple: define your pipeline stages clearly, base forecasts on real-time activity data rather than intuition, and stick to a consistent review schedule. When these practices become routine instead of last-minute efforts, forecasting accuracy becomes a dependable part of your operations.
Using outdated methods can cost companies up to 11% of their annual revenue due to outdated data and inaccurate predictions. For a business generating $150M in annual recurring revenue, that’s a staggering $16.5M lost. Meanwhile, only 24% of executives trust the forecasts they receive, leaving most organizations to make big decisions – like hiring, budgeting, or product launches – based on unreliable numbers.
Modern forecasting systems solve these issues. Tools with automated data capture and signal-based intelligence can push accuracy as high as 96%. But achieving this level of precision isn’t about working harder; it’s about using tools that enforce consistency and discipline. For example, Teamgate CRM ensures no deal is left without a next step, flags inactive deals before they stall, and gives managers instant visibility into deal progress and activity metrics.
"Forecasting isn’t a reporting task. It dictates headcount, spend, product timing, and executive confidence." – Grace Sweeney, Revenue Grid
When your CRM enforces follow-ups and builds an evidence-based pipeline, forecasting becomes the backbone of revenue protection. This leads to a pipeline leaders can trust – one that drives growth by design, not by chance.
FAQs
How do we define pipeline stages so everyone uses them consistently?
To keep your pipeline stages consistent, start by defining clear and measurable criteria for each stage, such as qualification, proposal, negotiation, and closing. Make sure these definitions are well-documented and shared with your team so everyone is aligned and understands the process.
A CRM like Teamgate can simplify this by providing visual dashboards and metrics to enforce these standards. Regular training sessions and periodic pipeline reviews are also crucial to avoid misclassified deals and to ensure your forecasting stays reliable.
What signs indicate a ‘Commit’ deal might be at risk?
A ‘Commit’ deal might be in trouble if you notice any of these red flags: deals that have been sitting untouched for too long, no clearly defined next steps, or if progress has stalled with little to no engagement. Keeping your pipeline clean and using up-to-date data can help you spot these risks early.
How often should we run forecast reviews and variance analysis?
Forecast reviews and variance analysis should happen regularly – ideally, every month. Doing this ensures your pipeline stays accurate, helps you spot potential risks early, and keeps your forecast trustworthy.