

If your forecast is off by even 5% to 10%, hiring plans, quotas, and spending can go wrong fast. I’d keep revenue forecasting simple: use a historical baseline, check live pipeline, test team capacity, and review manager commits every week. Teamgate gives growing sales teams clarity, structure, and trustworthy pipeline insight – without enterprise CRM bloat or feature overload.
Here’s the short version:
- Historical forecasting uses past revenue to project future results.
- Pipeline forecasting looks at open deals, stages, close dates, and commit calls.
- Lead-driven forecasting starts with lead volume and funnel conversion rates.
- Cohort forecasting fits SaaS and other recurring revenue models.
- Driver-based forecasting checks whether headcount, pipeline coverage, win rates, and deal size can support the number.
- Statistical models like regression, time-series, and Monte Carlo help when you have enough clean data.
- Clean CRM data matters more than fancy math. If stages, next steps, and close dates are stale, the forecast slips.
A few numbers make the point clear: 81% of finance and sales leaders say forecasts miss by at least 5%, and 43% say misses are 10% or more. Teams with weak CRM field completion can see forecast error near 22%, while teams with strong field completion can get that down to about 8%.
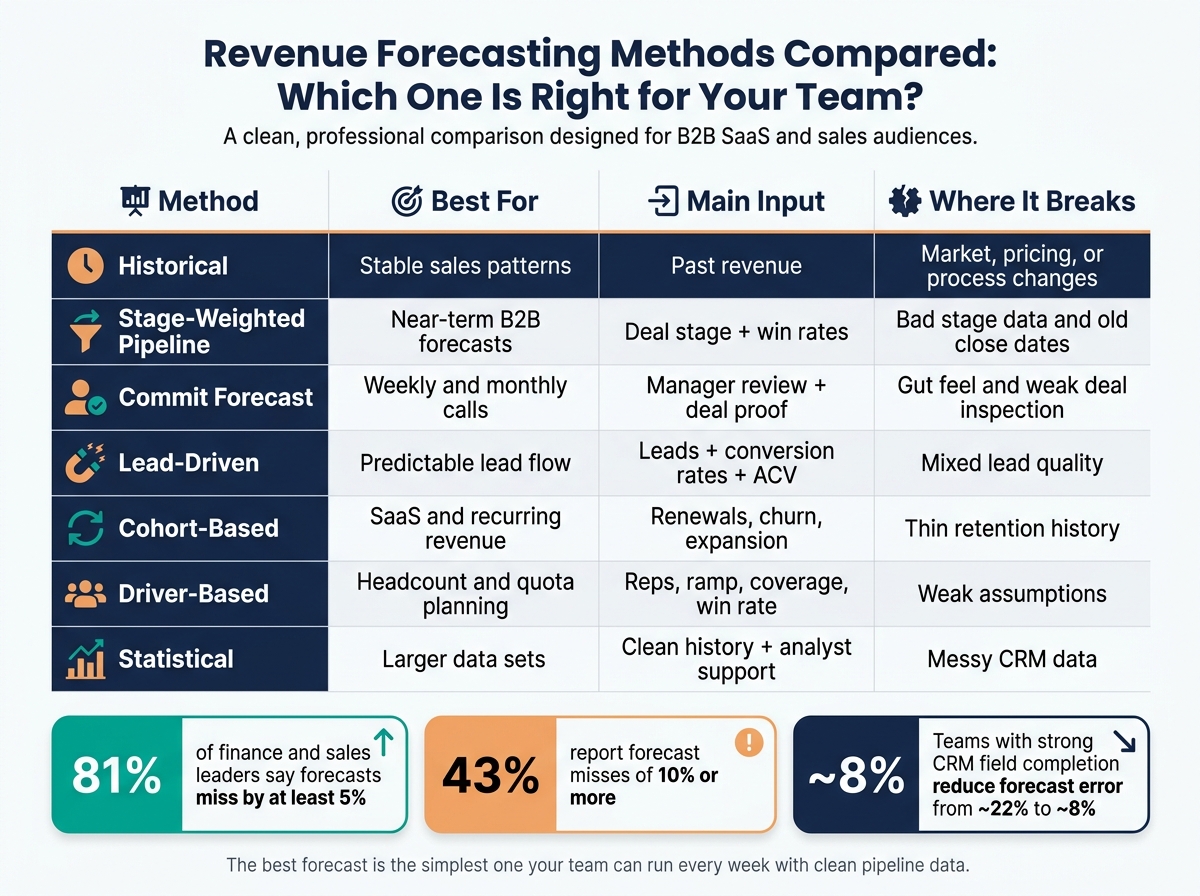
Revenue Forecasting Methods Compared: Which One Is Right for Your Team?
EP 40 | 12 Sales Forecasting Methods You Need to Know in 2025 | Outdoo Audio Blog
sbb-itb-5772723
Quick Comparison
| Method | Best for | Main input | Where it breaks |
|---|---|---|---|
| Historical | Stable sales patterns | Past revenue | Market, pricing, or process changes |
| Stage-weighted pipeline | Near-term B2B forecasts | Deal stage + win rates | Bad stage data and old close dates |
| Commit forecast | Weekly and monthly calls | Manager review + deal proof | Gut feel and weak deal inspection |
| Lead-driven | Predictable lead flow | Leads + conversion rates + ACV | Mixed lead quality |
| Cohort-based | SaaS and recurring revenue | Renewals, churn, expansion | Thin retention history |
| Driver-based | Headcount and quota planning | Reps, ramp, coverage, win rate | Weak assumptions |
| Statistical | Larger data sets | Clean history + analyst support | Messy CRM data |
My main takeaway: the best forecast is not the most complex one. It’s the one you can run every week with clean pipeline data, clear review rules, and numbers your team will actually update.
Historical Revenue Forecasting Techniques
Historical forecasting is your baseline. It uses past revenue to estimate future revenue, and it works best when your sales motion stays pretty steady – similar deal sizes, similar cycle length, and no major changes in pricing or market conditions. If you want a fast starting point before you look at live pipeline data, this is usually where to begin. Teamgate gives growing sales teams clarity, structure, and trustworthy pipeline insight – without enterprise CRM bloat or feature overload – so once you have a baseline, you can compare it against what deals are doing right now.
These methods are simple for a reason: they assume the past is a decent guide to the near future. That makes them useful, but only up to a point. If demand shifts, a big one-time deal lands, or your sales process changes, the forecast can drift off course fast.
Straight-Line, Moving Average, and Regression Methods
Straight-line forecasting is the usual first step. You take a recent growth rate – say 5% quarter over quarter – and carry it forward. If your team averaged $100,000 per month over the last 12 months and kept growing at about that rate, a straight-line model extends that path into the next quarter. It is fast, simple, and easy to explain, but it does not tell you why revenue is changing. It can also get thrown off by one unusually strong or weak quarter.
Moving averages deal with some of that noise. Instead of relying on one growth rate, they average recent periods – often the last 3, 6, or 12 months – to smooth out spikes and dips. A 4-quarter moving average, for example, can soften the effect of an outlier quarter or a slow month caused by delayed renewals. The downside is simple: it reacts late. If momentum is building or fading, the forecast may miss it for a while.
Simple regression adds a bit more rigor. It fits a trend line to past revenue and measures the direction and slope of that trend. That helps you see whether growth over the last 12 to 24 months looks meaningful or whether it may just be random variation. It gives you more than a rule of thumb, but it is still looking backward, and it still depends on clean, steady data.
Time-Series Methods That Account for Seasonality
Some revenue patterns repeat. Quarter-end pushes, slower summer months, and year-end budget spending are common examples in U.S. B2B sales. When that happens, straight-line models and plain averages can flatten the pattern too much. That is where time-series methods start to make more sense.
Exponential smoothing puts more weight on recent data while still using older history, so it reacts faster than a plain moving average. Holt’s method adds trend. Holt-Winters adds seasonality on top of level and trend, so it can model all three together. ARIMA and SARIMA follow a similar path, but they are usually better suited to teams with analyst support.
For many SMB and mid-market teams, Holt-Winters is often the most practical seasonal model. It fits a sales team that sees regular Q4 spikes and slower summer months without forcing them into heavier statistical work.
When Historical Methods Work and Where They Fall Short
Historical methods are most useful when the business has not changed much. If pricing is stable, deal sizes are similar, and there have been no major product launches or market shocks, these models can give leadership a fast directional number for budgeting and planning.
The limit is hard to ignore: historical methods work only when the past is stable; they fail when the business changes. For a more dynamic approach, see our guide to CRM sales forecasting. If revenue was not recorded in a consistent way, or if a few large one-time deals distorted the trend, the forecast can look cleaner than reality.
| Technique | Data needed | Best for | Main advantages | Key limitations |
|---|---|---|---|---|
| Straight-line | 12–24 months of stable revenue history | Quick directional planning | Fastest to build; easy to explain | Assumes the future mirrors the past; sensitive to outlier periods |
| Moving average | Last 3, 6, or 12 months of revenue data | Smoothing short-term volatility | Reduces noise from one-off deals or timing shifts | Slow to react to real momentum changes |
| Simple regression | 12–24 months of clean revenue data | Identifying trend direction and strength | Quantifies whether growth is statistically meaningful | Still backward-looking; breaks when business conditions shift |
| Exponential smoothing | 12+ months of revenue data | Teams with a clear trend and limited seasonality | Weights recent data more heavily; more responsive than a moving average | Requires tuning; no seasonal adjustment on its own |
| Holt-Winters | 2+ years with visible seasonal cycles | Teams with recurring quarterly or monthly patterns | Models level, trend, and seasonality simultaneously | Needs enough history for patterns to be measurable; can mislead if the market has shifted |
| ARIMA / SARIMA | 24–36 months of clean, consistent data | Teams with analyst support and more complex seasonal patterns | Flexible; handles autocorrelation and seasonality | Requires statistical expertise; overkill for most SMB teams |
Historical methods give you the baseline; pipeline methods test whether current deals can beat it.
Pipeline and Opportunity-Based Forecasting Techniques
Pipeline forecasting estimates near-term revenue from the deals you have right now, not from last year’s results. It works best when your team has enough active deals and your CRM reflects what is actually happening. Teamgate helps reps follow a clear sales process and helps managers trust the numbers – without turning CRM into a full-time admin job.
Here’s the short version:
- Stage-weighted forecasting estimates revenue by multiplying deal value by the win rate for that stage.
- Commit forecasting adds a confidence layer based on deal quality and timing.
- Lead-driven forecasting starts with lead volume and funnel conversion rates.
- Cohort-based forecasting is built for recurring revenue, where renewals, churn, and expansion matter.
Stage-Weighted Pipeline and Commit Forecasting
The basic math is simple: take each deal’s value, multiply it by the close probability for its current stage, and then add those weighted amounts across the quarter. A $100,000 deal in Proposal with a 40% close probability adds $40,000 to the forecast.
The hard part is not the formula. It’s setting the right probabilities.
Those stage probabilities should come from actual conversion data – specifically, how many deals that reached Proposal later closed. They should not come from gut feel. In most teams, the best approach is to refresh those probabilities every quarter using the trailing 12 months of won and lost deals.
When teams guess instead of using data, forecast error grows fast. If a team assigns a 50% close rate to a stage that has only closed at 35% in the past, that group of deals gets overstated by about 43%. That’s how a forecast starts to look good on paper and fall apart at the end of the quarter.
Commit, best-case, and upside sit above the stage-weighted model. These categories are about the confidence of closing within the period, not just the stage name. A deal belongs in commit when it has recent activity, a clear next step, a close date that makes sense, and no unresolved objections.
Lead-Driven and Cohort-Based Forecasting
Lead-driven forecasting starts earlier in the funnel. Instead of beginning with open deals, it starts with lead volume and applies conversion rates, sales cycle timing, and average deal size. The formula is straightforward: Revenue = Leads × Lead-to-Opportunity % × Opportunity-to-Win % × Average Contract Value (ACV).
This works best when lead generation is steady and the team has enough past data to calculate conversion rates by source, segment, or campaign. If paid search leads convert one way and partner leads convert another, lumping them together can blur the picture.
Cohort-based forecasting fits subscription and recurring revenue businesses. Rather than treating revenue as a one-time event, it groups customers by start date or acquisition cohort and projects how much revenue each group is likely to keep, lose, or grow in future months. That makes it useful for modeling renewals, churn, and expansion over time.
When you add up those cohorts, you get a forward-looking ARR model based on actual customer behavior, not just new-logo assumptions. From there, the next step is driver-based modeling.
What Pipeline-Based Methods Need to Be Reliable
Every method here depends on one thing: the pipeline has to reflect reality.
If deals sit in the same stage for months with no movement, stage-weighted forecasts stop meaning much. If close dates are wishful, commit categories break down. If conversion rates are not tracked by source or segment, lead-driven models drift off course.
One AI-assisted forecasting case study found that 40–60% of opportunities had outdated next steps or missing context, which hurt forecast accuracy until CRM discipline improved.
That’s why CRM hygiene matters so much. Stages, next steps, and close dates need to stay current if you want a forecast you can trust.
With that base in place, the main pipeline methods break down like this:
| Technique | Forecast Horizon | Typical Accuracy | Data Prerequisites | Best Fit |
|---|---|---|---|---|
| Stage-Weighted Pipeline | Weekly, Monthly, Quarterly | High (with CRM hygiene) | Deal value, stage-specific win %, estimated close date | SMB to Mid-Market; requires CRM discipline |
| Commit / Best-Case / Upside | Monthly, Quarterly | Very High | Manager validation, activity logs, next-step clarity | Mature teams with rigorous pipeline review processes |
| Lead-Driven Forecasting | Monthly, Quarterly | Medium | Lead volume, historical conversion rates, avg. deal size | High-growth teams with consistent, measurable lead flow |
| Cohort-Based Forecasting | Annual, Multi-year | High (for recurring revenue) | Renewal rates, churn data, expansion trends | Recurring revenue and SaaS teams |
Once pipeline data is clean, teams can add driver-based models and scenario ranges to get a broader view. When pipeline methods alone don’t cover enough ground, driver-based and statistical models add capacity, conversion, and scenario coverage.
Driver-Based and Statistical Forecasting Techniques
Deal forecasts tell you what might close. Driver-based forecasting tells you whether the team can produce the number at all. That’s the key shift. Instead of looking only at open deals, you look at the inputs behind revenue: headcount, ramp, pipeline creation, conversion, deal size, and cycle time. Teamgate gives growing sales teams clarity, structure, and trustworthy pipeline insight – without enterprise CRM bloat or feature overload.
At a glance, this section covers:
- How capacity models connect revenue targets to team output
- When regression, time-series, and Monte Carlo models make sense
- Why simpler models often work better for SMB and mid-market teams
- How CRM data quality shapes forecast accuracy
Pipeline methods predict closings. Driver-based models test whether the team can hit the number and what must change. That makes driver-based forecasting the link between deal-level forecasts and capacity planning.
Driver-Based Models Built from Sales Capacity
A driver-based forecast starts with the inputs that produce revenue: rep headcount, ramp time, pipeline created per rep, stage conversion rates, average deal size, win rate, and average sales cycle length. Instead of asking what happened last quarter, it asks what this team can likely produce with its current staffing and conversion rates.
A simple capacity model looks like this: sales capacity = number of reps × quota × average attainment. From there, leaders can work backward. They can estimate how many productive reps they need, how much pipeline each rep must create, and how long new hires will take before they start contributing.
Here’s where this gets useful. If one segment usually needs 3x pipeline coverage to support quota, but the team is only carrying 1.8x, the model shows the gap before it becomes a missed number. That gap might come from headcount, conversion, cycle time, or deal size. The point is that you can see it early.
Keep the model tight. Use 8 to 15 high-impact drivers like headcount, ramp time, pipeline created per rep, conversion rate, ACV, and churn so managers can update it in a weekly review without pulling in a data specialist.
When capacity alone doesn’t give enough detail, statistical models add probability and range.
Advanced Statistical Models and Scenario Ranges
With 12+ months of steady history, three statistical approaches start to make sense. Multi-variable regression tests several revenue drivers at once to show which inputs move revenue the most. Time-series models, including ARIMA and SARIMA, project repeatable seasonal patterns and trends forward. Monte Carlo simulation runs thousands of possible outcomes based on close probabilities, deal sizes, and cycle time distributions, so you see a range of results instead of one number.
Each method answers a different planning question:
- Regression explains revenue
- Time-series projects likely patterns
- Scenario modeling measures uncertainty
These models help most when a team has several segments that behave differently, enough deal volume to spot patterns, and a need to show uncertainty instead of giving one commit number.
There’s a catch, though. If the sales process changes often or CRM history is messy, these models can create false confidence instead of clarity.
How to Pick the Right Level of Complexity
The right model is the simplest one that answers the business question with acceptable accuracy. For most SMB and mid-market sales managers, a driver-based capacity model is enough for quarterly planning, headcount sizing, and pipeline coverage. Statistical models add more when you’re forecasting across multiple regions or product lines, or when leadership wants probability ranges rather than point estimates.
Data quality is the limiting factor. Teams with less than 70% completion of key CRM fields on active opportunities average forecast errors around 22%, while teams with more than 90% field completion see that error drop to about 8%. The four CRM fields most tied to forecast accuracy are documented next step, next step date, number of stakeholders, and competitive status. Advanced models don’t fix bad data – they magnify it.
That’s why CRM discipline is part of forecasting, not just admin work. The model only works if the CRM reflects current stages, next steps, and activity. Teamgate CRM supports that base by keeping stages current, surfacing overdue tasks, and making next-step visibility easy to maintain, so the activity history and pipeline data these models rely on are more dependable.
| Technique | Complexity | Data Maturity Needed | Strengths | Typical Pitfalls |
|---|---|---|---|---|
| Driver-based (capacity model) | Moderate | Medium | Links revenue to hiring, pipeline creation, and productivity | Oversimplifying ramp curves or conversion rates |
| Multi-variable regression | High | High | Reveals which inputs most strongly drive revenue | Garbage in, garbage out if CRM data is inconsistent |
| Time-series (ARIMA/SARIMA) | Moderate–High | Stable historical data | Captures seasonality and repeatable trends | Weak when the market or sales process changes frequently |
| Scenario / Monte Carlo | High | High | Shows outcome ranges and probability distributions | Can look precise without being truly reliable if stage probabilities are guesses |
Use the simplest model that answers the question, then move into forecast governance and review cadence.
How to Choose and Run the Right Forecasting Process
The best forecasting process is the one your team can run every week without drama. For most SMB and mid-market sales teams, that means using a few checks together, reviewing them weekly, and keeping CRM data clean enough to trust. Teamgate helps reps follow a clear sales process and helps managers trust the numbers – without turning CRM into a full-time admin job.
Here’s the simple version of what works:
- Use four checks together: historical run rate, live pipeline, capacity, and manager commit review
- Review forecasts weekly
- Ask for proof behind changes, not gut feel
- Keep close dates, next steps, stage, and ownership up to date
- Compare forecast vs. actuals so the process gets better over time
A Layered Forecasting Model for SMB and Mid-Market Teams
Once you know the main methods, the next step is putting them into a process your team can repeat. A good setup uses four checks: historical run rate, live pipeline, capacity, and manager commit review.
Here’s a simple example of how the layers work together: the historical baseline says $500,000, the pipeline forecast says $560,000, the driver model says $540,000, and the manager commit lands at $510,000. That gap tells you where to look before you lock the forecast. Used together, these layers give leaders a baseline, a live view of the pipeline, and a check on whether the team can actually deliver.
Forecast Reviews, Governance, and CRM Discipline
Process matters just as much as the model you pick. One pipeline governance article reports that companies without structured pipeline processes achieve only about 46% forecast accuracy, and just 21% land within ±10% of actual revenue.
For most growing B2B sales teams, a weekly forecast review is the right rhythm. Managers should ask for evidence behind every meaningful forecast change – recent buyer engagement, confirmed next steps, and stage progression – not just a rep’s confidence level. The point is to make the forecast better, not force people to defend a number.
A simple governance rule helps: every forecasted deal should have a current stage, a specific next action, a realistic close date, and a named owner who is accountable for updates.
This is where CRM discipline stops being “admin work” and starts shaping forecast quality. The failure points mentioned earlier – stale stages, missing next steps, and close dates that keep slipping – cause the most damage here. One guide measures data quality by checking the share of open opportunities with a close date, next step, ARR value, and last activity date. Scores below 60% are considered unacceptable for running reliable models. Teamgate CRM keeps close dates, next steps, and deal activity current so weekly forecast reviews rely on live pipeline data.
Tracking forecast versus actuals turns forecasting into a feedback loop. If deals in one stage close only 20% of the time but are being forecast at 50%, your stage probabilities need to change. If some reps keep committing too early, that’s a coaching issue, not a data issue. Over several quarters, this variance analysis sharpens stage weights, improves coverage targets, and surfaces hygiene problems before they stack up.
Conclusion: The Best Forecasting Method Is the One Your Team Can Run Consistently
Once the model is in place, consistency becomes the edge. The best forecasting process combines the few methods your team can run well, then backs them up with weekly review and clean CRM habits.
Predictable revenue comes from a repeatable process, clean pipeline data, and regular review – not from spreadsheet complexity. The best forecasting method is the simplest one your team can run with accuracy, every single week, without heroic effort.
FAQs
Which forecasting method should I start with?
Start with the method that fits your sales cycle, deal complexity, and how close your forecast needs to be. For short, simple sales cycles, pipeline-based forecasting is often the best place to begin. It uses your CRM’s deal stages and stage probabilities to estimate expected revenue. Teamgate helps reps follow a clear sales process and helps managers trust the numbers – without turning CRM into a full-time admin job.
As your sales process gets tighter, you can layer in historical trend analysis or AI-driven models to sharpen forecast accuracy. No matter which method you use, the forecast is only as good as the data behind it. Clean records and steady pipeline hygiene make the difference.
How much CRM data do I need for an accurate forecast?
You don’t need a huge pile of CRM data to forecast well. You need clean data. If deal stage, close date, deal value, and customer details are filled in correctly and kept current, your forecast has a much better shot at being right. Teamgate helps sales teams keep that structure in place, with a clear process and pipeline insight you can trust – without turning CRM into an admin-heavy mess.
Teamgate CRM supports this with standardized stages and disciplined data entry, so forecasts reflect current pipeline information instead of stale guesses. It also helps when you remove inactive deals and track next-step coverage, since both make the pipeline easier to trust.
How often should I review and update my forecast?
Review your forecast and audit your pipeline every week. That’s the simplest way to spot deal slippage, stalled activity, and priority changes before they turn into missed numbers. Teamgate gives growing sales teams clarity, structure, and trustworthy pipeline insight – without enterprise CRM bloat or feature overload.
Then go deeper once a month with a variance analysis. Compare forecasted revenue against actual results, look for gaps, and trace those gaps back to deal quality, rep updates, or stage movement. That steady review rhythm helps keep your pipeline clean, accurate, and tied to what’s happening in the field.