
Most sales teams struggle with outdated pipelines, missed follow-ups, and inaccurate forecasts. Interactive KPI dashboards solve these problems by turning raw data into real-time, actionable insights. They connect directly to your CRM, highlight overdue tasks, and provide visual tools to track deals, saving time and improving productivity. For SMBs, this means fewer missed opportunities and more reliable forecasts.
Key Takeaways:
- Real-time updates keep your pipeline accurate and actionable.
- Dashboards reduce admin tasks, giving reps more time to sell.
- Managers gain clear insights for coaching and forecasting.
Top Tools for SMBs:
- Teamgate CRM: Simple setup, clear pipelines, and actionable insights. Ideal for teams who want structure without complexity.
- Klipfolio: Customizable dashboards for multi-source data tracking.
- Geckoboard: Easy-to-read visuals for daily performance tracking.
- Power BI: Advanced analytics for teams in the Microsoft ecosystem.
- SimpleKPI: Straightforward tracking with budget-friendly pricing.
Quick Comparison:
| Tool | Best For | Ease of Use | Core Integrations | Pricing (USD/month) | Setup Time |
|---|---|---|---|---|---|
| Teamgate CRM | Pipeline management, fast setup | High | MailChimp, QuickBooks, Zapier | $0–$59.90/user | Hours |
| Klipfolio | Multi-source data tracking | Moderate | Salesforce, HubSpot, Pipedrive | $99–$799 | Moderate |
| Geckoboard | Visual performance tracking | High | Salesforce, Google Analytics | $49–$699 | Under 1 hour |
| Power BI | Advanced analytics, Microsoft users | Moderate | Excel, Office 365, Teams | Free–Varies | Less than 1 day |
| SimpleKPI | Budget-conscious metric tracking | Very High | Zapier, Excel, Google Sheets | $14–$129 | Within 1 hour |
Conclusion:
If your team struggles with pipeline clarity or wasted time on admin tasks, dashboards like Teamgate can help. Teamgate gives growing sales teams clarity, structure, and trustworthy pipeline insight – without enterprise CRM bloat or feature overload. Start with a pilot to see which tool fits your workflow best.
Make a Sales KPIs Dashboard in 15 minutes (+ Free Template)
sbb-itb-5772723
Why SMB Sales Teams Need Interactive KPI Dashboards
For many SMB sales teams, revenue loss doesn’t happen in dramatic, obvious ways – it happens quietly, through missed follow-ups and overlooked opportunities. Without real-time insights, leads grow cold, deals stall, and forecasts lose accuracy. The result? Wasted effort on demand generation, inefficient use of sales hours, and pipelines that fail to deliver results.
Interactive dashboards tackle these challenges by turning scattered data into actionable insights.
Fixing Pipeline Management Problems
A clean and well-managed pipeline is the backbone of predictable revenue. Without visual tools and real-time alerts, deals can languish unnoticed. Interactive dashboards solve this by using features like color-coded closing dates to highlight overdue opportunities and metrics such as deal age, activity coverage, and stage velocity. These tools give managers the clarity they need to step in early – before small issues grow into major bottlenecks. This ensures that deals without clear next steps don’t fall through the cracks, reducing the quiet revenue drain caused by neglect.
Instead of relying on guesswork to assess the health of opportunities, teams can make decisions based on clear, data-driven signals about deal progress and viability.
Boosting Sales Team Productivity
Sales productivity often takes a hit when reps are bogged down with administrative tasks. Many CRMs unintentionally make this worse by turning selling into a data-entry marathon. Interactive dashboards simplify workflows by centralizing key activities – emails, calls, meetings, and notes – and automating routine tasks like follow-ups through reminders and workflow triggers. This means reps spend less time on updates and more time on actions that move deals forward.
Dashboards designed with "at-a-glance" visuals allow SMB sales teams to quickly assess performance without sifting through complex reports. By clearly showing which deals need attention and outlining next steps, dashboards naturally integrate into daily workflows, making adoption easier and more intuitive. These streamlined processes not only improve pipeline clarity but also empower teams to act on insights faster.
Supporting Data-Driven Decisions
When better follow-ups and clear metrics prevent silent revenue losses, sales leaders can make decisions that strengthen the pipeline. Real-time, evidence-based insights become the foundation for accurate forecasts. Interactive dashboards provide actionable metrics like deal age, activity levels, next-step coverage, and stage conversion rates. These indicators help leaders differentiate between realistic forecasts and optimistic guesses.
With visibility into which reps are hitting activity goals and which deals are stalling, coaching becomes more focused and impactful. Dashboards turn routine pipeline reviews into strategic discussions, helping teams identify trends, spot risks, and adjust tactics based on up-to-date data. This ensures that decisions are grounded in reality, keeping the pipeline healthy and reliable.
Best Interactive KPI Dashboard Tools for SMB Sales Teams
Choosing the right dashboard tool can be the key to transforming your sales pipeline into a well-oiled, deal-closing machine. For SMB sales teams, the priority lies in tools that are easy to set up, integrate seamlessly with existing workflows, and deliver rapid, actionable insights. Below are five standout options, each offering a unique combination of usability, integration, and insights tailored to SMB sales.
Teamgate CRM: Built for Predictable Revenue
Teamgate CRM focuses on keeping a clean sales pipeline and minimizing revenue leaks. Its visual deal pipeline uses structured stages, color-coded indicators for overdue tasks, and aging deal alerts to ensure nothing slips through the cracks. Real-time activity tracking reduces the need for manual updates by automatically logging sales interactions.
Designed with sales reps in mind, Teamgate integrates effortlessly into daily workflows. It centralizes tasks like follow-ups, meeting notes, and conversations, so updates happen naturally instead of being forced by management. Automated reminders make follow-ups second nature, while managers gain insights into deal age, activity levels, and next-step coverage to coach and forecast effectively. Best of all, setup is quick – taking just hours, not weeks – so teams can start benefiting immediately. Teamgate is ideal for teams seeking clarity, discipline, and a CRM that’s easy to adopt.
Klipfolio: Real-Time KPI Visualization
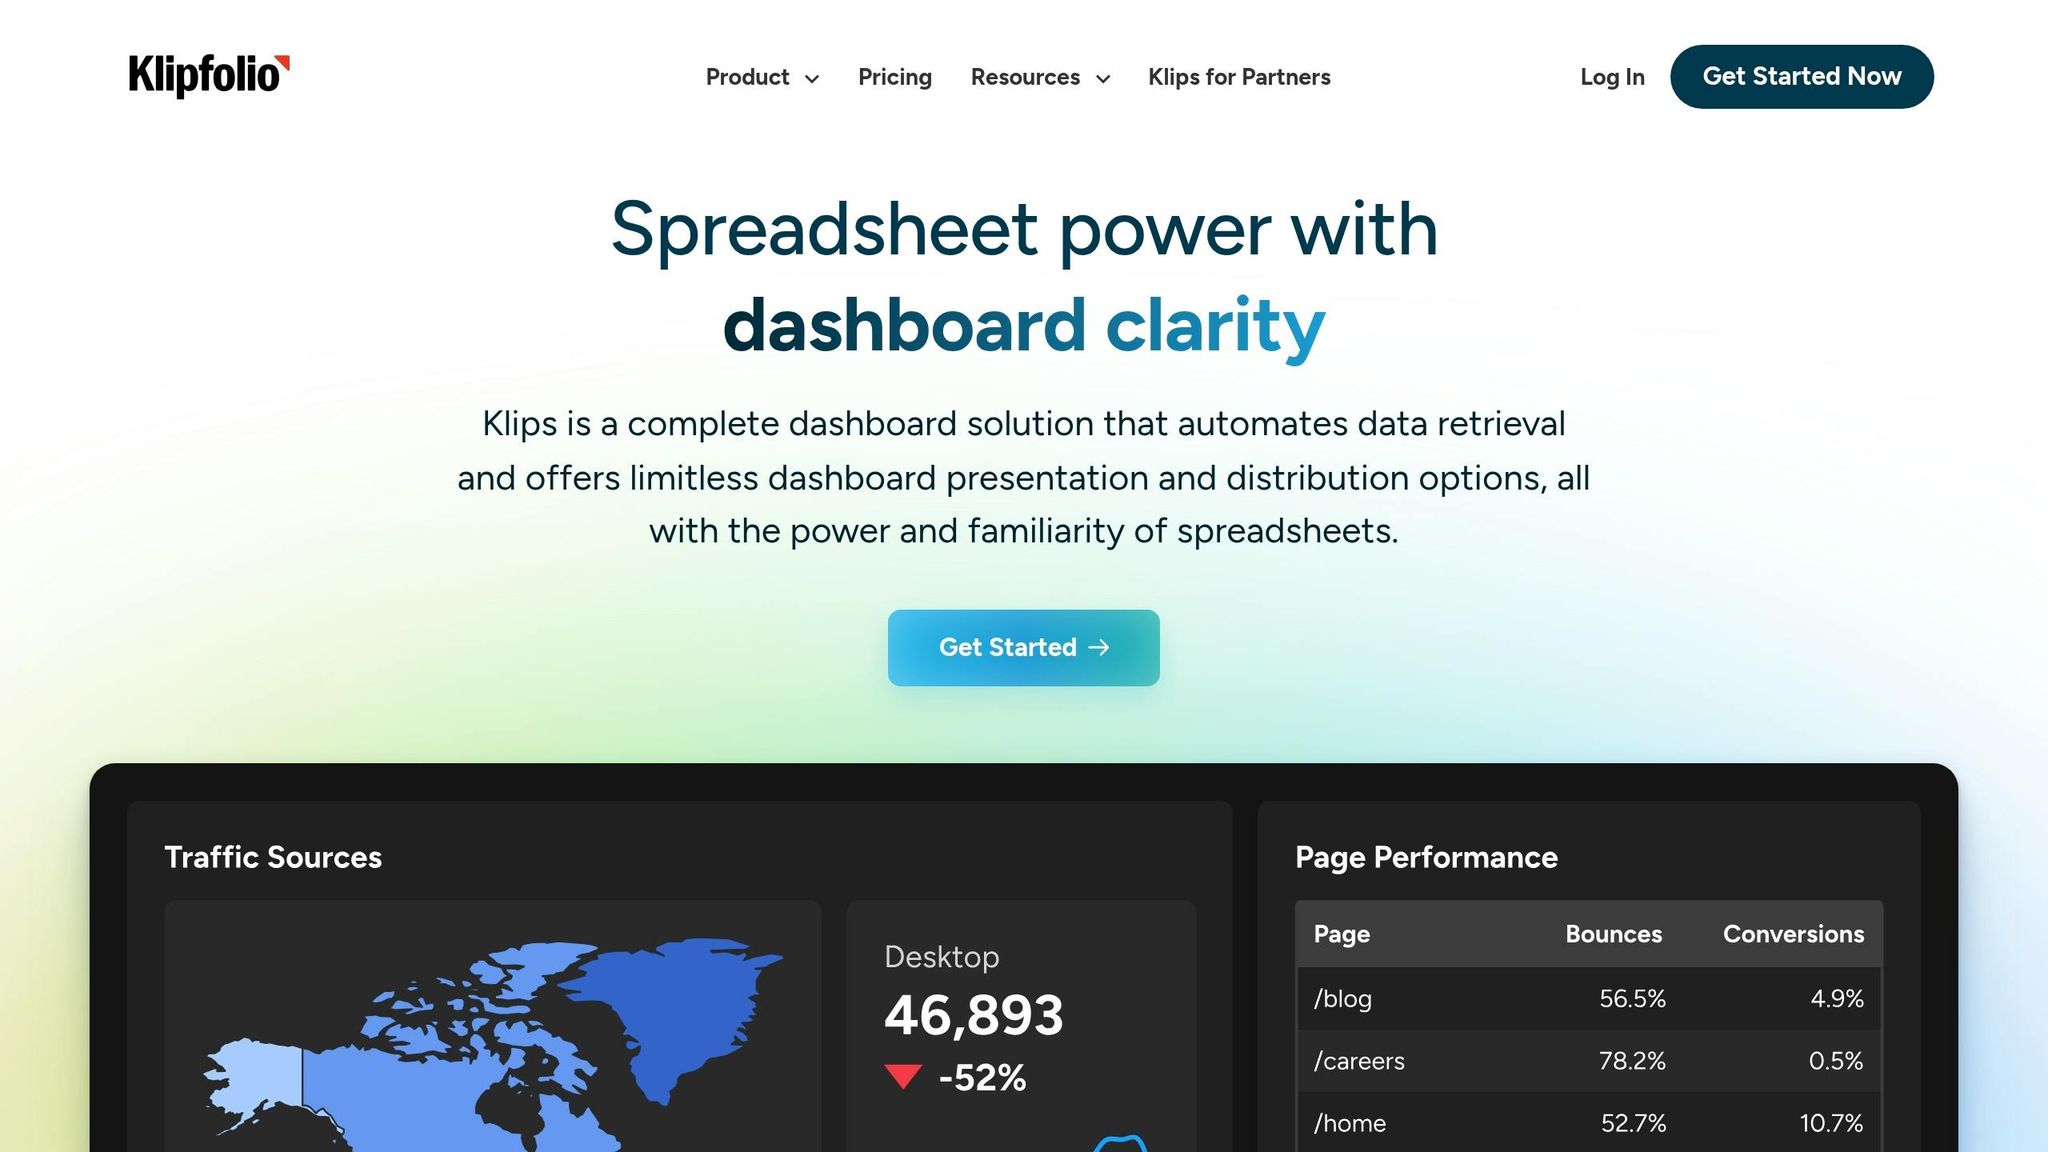
Klipfolio offers customizable dashboards with a simple drag-and-drop interface, perfect for tracking metrics like pipeline progress, conversion rates, and team performance in real time. It connects to over 130 CRMs and platforms, including Salesforce, HubSpot, and Pipedrive, through pre-built connectors and APIs for instant data syncing.
Its PowerMetrics feature ensures consistent KPI tracking across teams, eliminating discrepancies between sales and finance metrics like revenue attribution. For SMBs needing consolidated data from multiple sources, Klipfolio’s data blending capabilities create unified, actionable dashboards. Pricing starts at around $149 per month for small business plans.
Geckoboard: Simplified Sales Performance Tracking
Geckoboard specializes in clean, TV-friendly dashboards that make daily sales performance easy to monitor. With pre-built templates, multiple chart types, and visual elements like target meters and traffic light indicators, teams can quickly assess their progress at a glance.
The platform integrates with over 90 tools, including Salesforce and Google Analytics, and allows dashboards to go live in under an hour using its drag-and-drop builder. Automated email reports and Slack notifications keep teams aligned on key metrics without the need for manual reporting.
Power BI: Advanced Analytics for Sales Metrics
For SMBs already using Microsoft tools, Power BI offers seamless integration with Excel, Office 365, Teams, and SharePoint. It provides advanced visualizations, DAX formulas for complex sales calculations, and AI-powered anomaly detection to highlight trends in your pipeline data.
Power BI is cost-effective for Microsoft users and embeds directly into Teams or SharePoint workflows. With row-level security, sales reps only see data relevant to them. Setting up basic dashboards can often be done in less than a day, making it a practical choice for businesses already in the Microsoft ecosystem.
SimpleKPI: Easy Sales KPI Tracking
SimpleKPI is designed for SMBs that want straightforward sales metric tracking without the complexity of a full business intelligence platform. It features pre-built KPI templates, interactive charts, and goal tracking for metrics like revenue, deals closed, and pipeline health.
The tool integrates with Zapier, Excel, and Google Sheets for basic CRM connectivity. Its pricing is transparent, starting at $14 per user per month, with options for small teams ($49 per month) and unlimited users ($129 per user per month). A 14-day free trial is available, and most teams can start seeing results within an hour of setup.
These tools show how interactive dashboards can turn raw sales data into actionable insights, helping SMBs make smarter, faster decisions.
Comparing Interactive KPI Dashboard Tools
Interactive KPI Dashboard Tools Comparison for SMB Sales Teams
Choosing the right interactive KPI dashboard tool is crucial for SMB sales teams aiming to improve pipeline management through effective CRM implementation, track performance, and gain actionable insights from your sales data. This comparison highlights the key features, pricing, and implementation speeds of five popular tools, helping you decide which one aligns best with your team’s needs.
Feature and Pricing Comparison Table
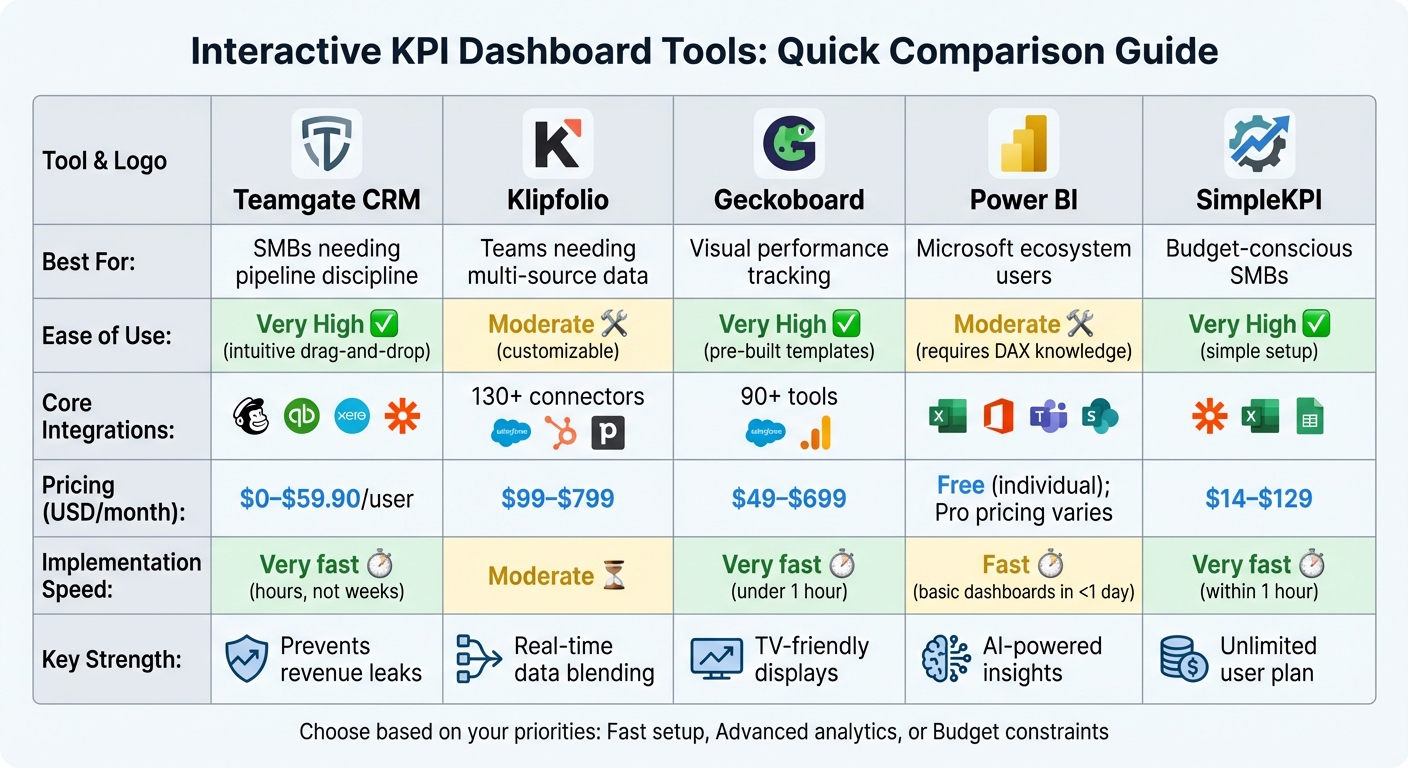
The table below outlines how these tools perform across critical factors like ease of use, integration options, pricing, and setup time.
| Tool | Best For | Ease of Use | Core Sales Integrations | Pricing (USD/month) | Implementation Speed |
|---|---|---|---|---|---|
| Teamgate CRM | SMBs needing pipeline discipline | High – intuitive drag-and-drop | MailChimp, QuickBooks, Xero, Zapier | $0–$59.90/user | Very fast (hours, not weeks) |
| Klipfolio | Teams needing multi-source data | Moderate (customizable) | 130+ connectors (Salesforce, HubSpot, Pipedrive) | $99–$799 | Moderate |
| Geckoboard | Visual performance tracking | High – pre-built templates | 90+ tools (Salesforce, Google Analytics) | $49–$699 | Very fast (under 1 hour) |
| Power BI | Microsoft ecosystem users | Moderate (requires DAX knowledge) | Excel, Office 365, Teams, SharePoint | Free (individual); Pro pricing varies | Fast (basic dashboards in <1 day) |
| SimpleKPI | Budget-conscious SMBs | Very high – simple setup | Zapier, Excel, Google Sheets | $14–$129 | Very fast (within 1 hour) |
Key Insights on Features and Use Cases
The differences between these tools become more apparent when considering how they impact daily sales operations. For example, Teamgate CRM stands out for its simplicity and quick adoption. Jack Hodges, Sales Manager at FiveCRM, shared:
"With Teamgate’s intuitive interface, our user adoption was immediate. Even with a remote team… we were onboarded and up and running within hours".
When it comes to pricing, scalability is a major factor. SimpleKPI offers an unlimited user plan for $129/month, making it a cost-effective option for growing teams. Meanwhile, Teamgate provides a free tier for up to two users, scaling to $59.90/user/month for advanced features. Krish Sivanathan, Director of Operations at Packagecloud, highlighted how actionable insights can drive results:
"Utilizing sales insights we have been able to conduct targeted experiments, enabling Packagecloud to increase engagement rates by 18% through the refinement of scripts and lead targeting".
Real-Time Capabilities and Advanced Analytics
For real-time data visualization, Klipfolio and Geckoboard are excellent choices, offering seamless integration with multiple data sources. Power BI, on the other hand, leverages AI to detect anomalies and surface trends automatically. In contrast, SimpleKPI focuses on straightforward metric tracking, ideal for teams without the need for complex analytics.
Choosing the Right Tool for Your Needs
Your choice depends on your team’s priorities:
- Fast implementation: Teamgate, Geckoboard, and SimpleKPI let you build dashboards quickly, often within an hour.
- Advanced analytics: Power BI and Klipfolio provide deeper insights for data-driven strategies.
- Budget-friendly options: SimpleKPI’s unlimited user plan and Teamgate’s free tier cater to cost-conscious teams.
For SMBs without dedicated data teams, tools that enable non-technical users to create dashboards quickly can be game-changers. These comparisons offer a strong foundation for identifying the right tool to enhance your sales operations, setting the stage for the next discussion on optimizing your processes.
Choosing the Right Interactive KPI Dashboard for Your SMB Sales Team
What to Look For
The difference between a dashboard that becomes a daily tool and one that gets ignored boils down to three key factors: adoption and implementation, quick setup, and seamless integration. These aren’t just extras – they’re the foundation of whether your team will rely on the dashboard or leave it unused.
- Adoption rates: A dashboard packed with features won’t matter if it’s too complicated to use. An intuitive design ensures your team can track pipelines easily without feeling overwhelmed, which leads to consistent usage.
- Setup speed: Time is critical for SMBs. Look for dashboards with pre-built templates and drag-and-drop interfaces that allow you to create live dashboards in hours instead of days.
- Integration capabilities: A dashboard should fit into your existing workflow, not disrupt it. Check for compatibility with your CRM, email tools, and accounting software. For instance, Power BI connects to multiple data sources for real-time updates, while Geckoboard pulls in data from various applications, reducing manual input and saving time.
By focusing on these factors, you can match the tool’s features to your sales team’s specific needs.
Matching Tools to Your Sales Process
The features you prioritize should align with how your sales team operates. For example:
- Pipeline management: If your team focuses on moving deals through the pipeline, choose dashboards with visual tools like Kanban boards and enforced next steps. Teamgate CRM, for instance, ensures every deal requires a defined action, keeping opportunities from stalling.
- Forecasting accuracy: Teams prioritizing accurate forecasts should consider dashboards with AI-driven analytics. Power BI’s anomaly detection highlights trends that manual tracking might miss, while other tools offer custom metrics tailored to your sales goals.
- Budget considerations: Pricing matters, especially for SMBs. SimpleKPI offers an unlimited user plan for $129/month, suitable for growing teams. Teamgate provides a free tier for up to two users, allowing smaller teams to try its disciplined pipeline management features without upfront costs.
Before committing, run a pilot test. Monitor rep login rates (aim for 80% or higher), track how quickly the dashboard is set up, and gather feedback from your team after one or two weeks. The goal is to ensure the tool supports daily selling activities rather than adding unnecessary tasks. Dashboards that centralize emails, calls, and activity histories tend to see higher adoption rates because they enhance productivity instead of creating extra work.
Conclusion
Interactive KPI dashboards help small and medium-sized businesses (SMBs) protect their revenue by turning raw data into actionable insights. They tackle common sales challenges like stalled deals, inconsistent follow-ups, and unreliable forecasts by highlighting key metrics – such as deal age, activity levels, and next-step coverage – in real time. This shift from guesswork to data-driven decision-making allows managers to coach effectively and ensures follow-up processes are consistent and reliable.
The right dashboard enhances three key areas that directly affect revenue: pipeline discipline, sales rep productivity, and forecast accuracy. As Teamgate states, "Accurate CRM reports and analytics are essential for identifying strengths and weaknesses among a sales team… and any shortcomings in sales cycles".
When choosing a tool, SMBs should prioritize fast setup, CRM integrations, and ease of use. Teamgate CRM is specifically designed to prevent revenue loss by eliminating "no next step" scenarios and flagging aging opportunities before they expire. Its pricing supports quick adoption without unnecessary complexity, including a free tier for up to two users.
To get started, consider running a short two-week pilot with your team and collecting their feedback. The goal isn’t to find the tool with the most features – it’s to find one your team will actually use because it makes their jobs easier. When dashboards centralize emails, calls, and activity histories in one place, adoption becomes effortless, and your pipeline becomes more predictable.
FAQs
Which KPIs should an SMB sales dashboard track?
An SMB sales dashboard should focus on tracking key metrics that provide a clear picture of sales performance, pipeline health, and team productivity. Important indicators include:
- Sales trajectory: Monitors progress toward revenue goals.
- Win/loss rates: Highlights how often deals are closed successfully.
- Sales cycle length: Measures the average time it takes to close a deal.
- Pipeline coverage: Ensures there are enough opportunities to meet targets.
- Lead conversion rates: Tracks how effectively leads turn into customers.
- Activity metrics: Includes data on calls, emails, and meetings to assess team effort.
Additional data points, such as top reasons for lost deals, forecasted revenue, and sales velocity, can reveal problem areas, improve forecasting accuracy, and ensure the pipeline remains clean and actionable for steady revenue growth.
How do I get reps to actually use the dashboard?
To get your sales reps to actively use the dashboard, make sure it aligns with their daily workflow. Keep it simple to update and packed with insights they can act on. Tailor the metrics to their roles – like tracking daily productivity for reps or monitoring team trends for managers. Add visual tools, such as pipeline aging indicators and clear next steps, to make the process intuitive. When reps see how it streamlines their tasks and speeds up closing deals, they’ll be much more likely to use it regularly.
What should a 2-week dashboard pilot include?
A 2-week dashboard pilot should center on key milestones: setup, testing, and training. The process involves configuring critical KPIs such as sales activity, deal progression, pipeline health, and forecasts. Once set up, testing ensures the data is accurate and the dashboard is easy to use. Product demonstrations play a crucial role, helping users understand how to interpret the data effectively and turn insights into actionable steps.