CRM dashboards simplify how sales teams analyze and act on data. By transforming raw numbers into clear visuals like charts and graphs, these tools help teams quickly understand sales performance, track progress, and make better decisions. Key metrics such as pipeline health, revenue forecasts, and team productivity are displayed in one place, reducing the need for manual reports and guesswork. Highlights include:
- Real-time updates: Monitor pipelines and address bottlenecks immediately.
- Key metrics: Focus on deal stages, win/loss ratios, and sales velocity for actionable insights.
- Role-specific views: Tailored dashboards for sales reps, managers, and executives ensure relevant data for everyone.
- Predictive analytics: Use past trends to forecast future outcomes and identify risks.
- Automation: Alerts and workflows save time by handling repetitive tasks.
CRM dashboards not only streamline operations but also help teams focus on what drives results. Platforms like Teamgate CRM make it easy to set up and customize these tools for businesses of any size.
Mastering CRM dashboards: transforming data into business insights
Key Metrics for Sales Performance
Essential CRM Dashboard Metrics for Sales Teams by Role
Your dashboard should focus on metrics that matter most – pipeline health, revenue performance, and sales activities. These are the numbers that drive results. Tracking too much creates unnecessary noise; focusing on the essentials brings clarity.
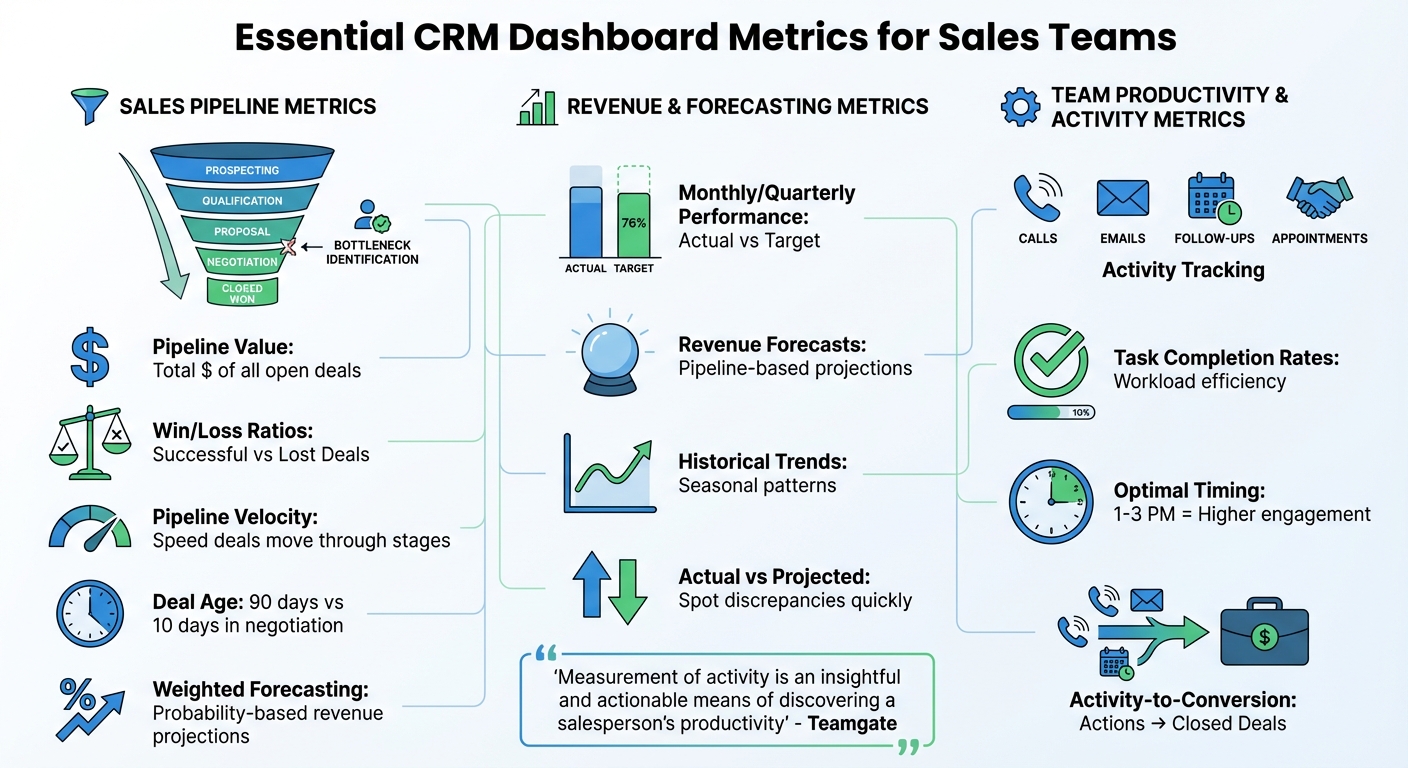
Sales Pipeline Metrics
Deal stages map out where each opportunity stands in your sales process, making it easier to identify bottlenecks before they escalate. If deals pile up in one stage, it often signals a process issue. Pipeline value, the total dollar amount of all open deals, gives you a snapshot of potential revenue. Meanwhile, win/loss ratios help you evaluate which strategies are working by comparing successful deals to lost opportunities.
Pipeline velocity – the speed at which deals move through stages – offers insight into revenue timing. For instance, a $50,000 deal stuck in negotiation for 90 days requires different attention than one that’s only been there for 10 days. Monitoring deal age helps you intervene early when deals stall. Additionally, weighted pipeline forecasting – which factors in the probability of closing each deal – provides more realistic revenue projections than treating all opportunities equally.
Together, these metrics lay the groundwork for accurate sales forecasting, as explored in the next section.
Revenue and Forecasting Metrics
Building on pipeline data, revenue and forecasting metrics sharpen decision-making. Key indicators include monthly and quarterly sales performance against targets, revenue forecasts based on current pipeline data, and historical sales trends to uncover seasonal patterns. Displaying actual revenue alongside projected revenue helps teams quickly spot and address discrepancies. This turns forecasting into a strategic, data-driven process rather than guesswork.
By combining historical data with real-time insights, you can create precise forecasts based on deal size, sales cycles, and conversion rates. For even greater accuracy, use historical conversion rates for each stage of your pipeline.
Team Productivity and Activity Metrics
Beyond pipeline and revenue metrics, tracking team productivity ensures every action contributes to sales success. Activity tracking sheds light on daily tasks – calls made, emails sent, follow-ups completed, appointments scheduled, and more. These metrics provide a clear view of key performance indicators (KPIs) across team members, regions, and pipeline stages.
For example, analytics might reveal that calls made between 1–3 PM lead to higher engagement. Armed with this data, reps can adjust their schedules to maximize results. Task completion rates also indicate how efficiently team members manage their workload. By comparing activities at different pipeline stages to closed deals, you can pinpoint which actions – like follow-up frequency or specific meeting types – drive conversions.
As Teamgate notes:
"Measurement of activity is an insightful and actionable means of discovering a salesperson’s productivity".
If a salesperson has a high volume of meetings but struggles to close deals, they may need coaching on closing techniques rather than lead generation. This kind of visibility helps teams focus on the activities that deliver the best return on their time and effort.
Setting Up Dashboards for Real-Time Insights
Once you’ve identified the key metrics, the next step is setting up dashboards that provide a clear, real-time view of performance. A well-designed dashboard should present essential information at a glance without overwhelming users with excessive data.
Choosing the Right Visualizations
The type of visualization you choose can make or break your dashboard’s effectiveness. Here’s how to match the chart to your data:
- Bar charts: Compare categories side by side.
- Line graphs: Highlight trends over time.
- Funnel charts: Track progress through sales stages.
- Pie charts: Show proportions when dealing with a few categories.
- Scatter plots: Reveal correlations between variables.
- Heat maps: Identify patterns across datasets.
Getting this right is crucial. Kyle Dorman, Department Manager – Operations at Ray White, shared the impact of a well-optimized dashboard:
"There’s probably about a 70% increase in efficiency in regards to the admin tasks that were removed and automated, which is a huge win for us".
Organizing Dashboard Layouts
To make dashboards intuitive and user-friendly, focus on layout:
- Place the most critical metrics (around five to eight) in the top-left corner, as this is where users naturally look first.
- Use clear headers and leave enough white space to keep the design clean and prevent visual clutter.
- Include drill-down options for users who need to explore detailed data.
Customizing dashboards for specific roles ensures that everyone gets the information they need. For example:
- Sales reps: Task-oriented details to guide daily activities.
- Managers: Team-wide performance views.
- Executives: High-level summaries for strategic decision-making.
Additionally, make sure the design is mobile-friendly with large, easy-to-tap elements for field teams.
Using Color Coding and Alerts
Color coding and alerts can make dashboards even more actionable:
- Use a "traffic light" system: green for positive trends, yellow for warnings, and red for critical issues.
- Set up automated alerts for key events, like when a sales rep hits their quota or a deal has stalled in the pipeline.
- Tailor alerts based on roles: sales reps can receive task-specific notifications, while managers get team-wide updates.
Modern CRM dashboards often include conditional labels to flag urgent issues automatically. For instance, deals that haven’t been contacted in a set timeframe or opportunities that have moved backward in the sales cycle can be highlighted for immediate attention.
To keep everything up-to-date, ensure your dashboard refreshes every 15–30 minutes. This real-time synchronization eliminates data delays and ensures everyone is working with the most accurate information. With these tools in place, your team can quickly adapt their strategies to maximize performance.
Customizing Dashboards for Different Roles
When it comes to real-time insights, tailoring dashboards to fit specific roles takes things a step further. It ensures that every team member sees the data that matters most for their day-to-day tasks. Think about it: a sales rep on the ground has very different needs compared to an executive planning next quarter’s strategy. Customizing dashboards for roles isn’t just nice to have – it’s critical. It clears out the noise, leaving only the metrics that drive success for each user.
A well-designed sales dashboard reflects the unique responsibilities of each role. For example, sales reps need actionable data, managers require team-wide visibility, and executives rely on high-level summaries for strategic decision-making. Let’s dig into how dashboards can be tailored for these three key roles to ensure every action has impact.
Dashboards for Sales Representatives
For sales reps, dashboards should focus on the essentials: real-time pipeline overviews, call and email logs, task lists, and quota tracking. A "hot lead" filter can be a game-changer, helping reps zero in on high-priority prospects. Keep the metrics simple – five to seven key data points are ideal, as research shows that people can process only a handful of ideas at once [18].
Dashboards for Sales Managers
Managers need a broader view to guide their teams effectively. Their dashboards should feature metrics like win/loss ratios, average sales cycles, and pipeline value. Adding a "Wall of Shame" to flag overdue tasks, stalled deals, or missed opportunities can help managers stay on top of team performance. For example, a major South African bank used this approach to boost its one-call closure rate by 61% and cut customer complaints by 8% in just one quarter [18]. Leaderboard-style widgets can also encourage healthy competition while keeping performance metrics front and center.
Dashboards for Executives
Executives require a high-level perspective. Their dashboards should spotlight metrics like monthly recurring revenue, overall revenue growth, market trends, and unit economics such as ACV and win rates. One notable example comes from Business Intelligence Consultant Rohit Keserwani, who reported that implementing an executive-level CRM dashboard helped a Fortune 500 company in the U.S. achieve a 7% increase in customer satisfaction and an 11.3% boost in lead conversion from agency channels [18].
"Organizations are demanding CRM dashboards that help them quickly decide what actions to take. If the dashboard tells me that my lead conversion ratio is falling because the customer satisfaction score is going down, I can quickly act to improve the score."
– Rohit Keserwani, Business Intelligence Consultant [18]
Tools like Teamgate CRM (https://teamgate.com) make it easy to customize dashboards for sales reps, managers, and executives, ensuring that everyone has access to the insights they need to make smarter, faster decisions.
sbb-itb-5772723
Using Predictive Analytics and Automation
Dashboards designed for specific roles become even more powerful when paired with predictive analytics and automation. These tools help teams anticipate sales trends and take action before challenges arise. While real-time insights show what’s happening now, predictive analytics prepare you for what’s coming next. This means sales teams can address potential issues before they impact revenue.
Predictive analytics rely on historical data to forecast outcomes, while automation handles repetitive tasks that would otherwise drain time and energy. Together, they transform dashboards into tools that not only display current data but also predict future trends and automatically respond to key events. Companies with advanced analytics capabilities are twice as likely to rank in the top quartile of financial performance within their industries.
Using Historical Data for Forecasting
Historical sales data plays a crucial role in predicting future outcomes. CRM dashboards analyze metrics like deal closure rates, lead conversion history, and sales cycle length to forecast trends and revenue projections. For example, tracking how long it typically takes for a deal to close can help estimate when revenue will materialize.
Predictive tools also highlight high-risk deals needing immediate attention and provide insights into why deals are lost – whether it’s due to pricing, competition, or timing. By analyzing correlations between past activities (like calls or meetings) and deal outcomes, managers can gauge future success based on the current effort levels of their teams.
| Historical Data Type | How It’s Used in Predictive Analytics | Dashboard Visualization Method |
|---|---|---|
| Win Ratios by Stage | Predicts closing likelihood based on pipeline position. | Funnel chart with percentage overlays. |
| Lead Source | Scores new leads using historical conversion success. | Lead score ranking or heat map. |
| Activity Metrics | Links call/meeting volume to predicted deal outcomes. | Activity vs. Results bar charts. |
| Loss Reasons | Highlights patterns in failed deals to flag risks. | Pie chart of "Top Loss Reasons." |
| Sales Cycle Time | Estimates close dates for current opportunities. | Pipeline movement or "Time-in-Stage" reports. |
By comparing current activity with similar periods from previous years, you can determine if your team is on track. Additionally, automated alerts can notify teams when deals remain stagnant for longer than the average sales cycle, helping to manage risks effectively.
Setting Up Automated Alerts and Workflows
Automated alerts and workflows build on predictive insights to keep the sales process agile and responsive. Setting estimated closing dates for deals can trigger alerts when deadlines are missed, ensuring no opportunities slip through the cracks.
For instance, when a lead reaches the final steps of an automated sequence, the dashboard can notify a sales rep to step in for a personal follow-up. This smooth transition between automation and human interaction boosts efficiency while maintaining a personal touch.
Integrating all communication and operational tools into the CRM creates a unified data source, eliminating silos and improving the accuracy of automation. As Gray Rentz, Senior Director at Polaris, explains:
"A unified customer view means richer customer conversations with deeper communications".
Platforms like Teamgate CRM (https://teamgate.com) take this a step further with workflow automations that help teams stay proactive without adding manual work. These tools ensure sales teams are always ready to seize opportunities.
Applying Dashboard Insights to Sales Strategies
CRM dashboards are only as useful as the actions they inspire. The data they provide should replace guesswork, creating a foundation of transparency and trust in decision-making. As Ryan Harwood, CEO of PureWow, points out:
"Not everyone will always agree with you, but they’re much more likely to respect the decision if they understand the thought process behind it".
By leveraging these insights, you can turn raw data into actionable strategies that enhance every aspect of your sales operations.
Identifying Patterns and Trends
Real-time and predictive analytics can be game-changers, especially when used to refine your sales strategies. Start by examining your sales funnel to identify where deals tend to stall or fall apart. For example, tracking why deals are lost – whether it’s due to pricing concerns or competitor advantages – can highlight areas where your approach needs adjustment. Monitoring win rates at specific stages of the pipeline can also pinpoint weak spots, guiding targeted coaching on skills like proposal writing or negotiation.
The link between activity and outcomes is another key insight. Your dashboard might reveal that higher call volumes or multiple meetings lead to better win rates. With this information, you can set activity benchmarks and use them to coach underperforming team members.
Lead source effectiveness is another valuable metric. If certain marketing channels consistently bring in higher-quality leads, reallocating resources to those channels can boost your ROI. CRM marketing reports can further break down campaign performance, helping you fine-tune your approach.
Timing also plays a critical role. For instance, a "Deals over 12 Months" graph might show seasonal dips, enabling you to prepare for slower periods. Or, if the data shows that calls made between 1:00 PM and 3:00 PM yield better results, you can focus outreach efforts during those peak hours.
Improving Decision-Making Processes
The insights from dashboards don’t just highlight trends – they can directly improve your decision-making. By eliminating guesswork, dashboards provide objective data to guide choices. For example, if you’re debating whether to invest in training or hire more sales reps, the data can reveal whether the issue lies in pipeline coverage or conversion rates. This clarity ensures resources are allocated effectively, such as prioritizing tailored training over expanding the team.
Dashboards also elevate coaching by replacing vague advice with actionable feedback. Comparing individual reps’ performance against team averages can uncover specific areas for improvement, leading to more focused and productive coaching sessions.
Pipeline hygiene can also benefit from dashboard insights. A "Wall of Shame" approach, where overdue opportunities and stalled deals are flagged, encourages reps to keep their data current and pipelines clean.
Dashboards further enhance collaboration across teams. When marketing sees which campaigns generate the highest-quality leads, they can adjust their strategies. Similarly, product teams can use loss data to better understand customer pain points. As Gray Rentz, Senior Director at Polaris, puts it:
"A unified customer view means richer customer conversations with deeper communications".
Resource allocation becomes clearer with dashboard insights. For example, if deals with your Ideal Customer Profile (ICP) consistently perform better, you can focus prospecting efforts on those target accounts. Similarly, aligning roles based on individual strengths – like assigning enterprise accounts to a rep who excels with larger clients – can significantly boost team performance.
Teamgate CRM offers customizable dashboards that track everything from win ratios to sales activity outcomes. With Advanced Analytics in their Growth plan, teams can segment performance data by lead source, deal size, and sales cycle length, making it easier to identify patterns and adjust strategies on the fly.
Measuring Dashboard Impact on Sales Performance
After implementing CRM dashboards, it’s essential to demonstrate their value by evaluating performance improvements and calculating financial returns.
Tracking Performance Improvements
To measure the impact of your dashboards, track both outcome metrics (like deals closed, win rates, and revenue growth) and activity metrics (such as calls, emails, and meetings). Monitoring both types of metrics helps you identify which actions lead to the best results.
Start by establishing benchmarks for key metrics like conversion rates, sales cycle lengths, and average deal sizes. Compare these figures before and after using dashboards to assess improvements. For instance, Big Dog Solar, a solar panel installation company in the U.S., switched from manual reporting to automated CRM dashboards. By analyzing their most effective strategies and lead sources, they achieved a 40% revenue increase.
Another critical area to monitor is pipeline health. Dashboards can help pinpoint where deals are getting stuck in your sales funnel. Addressing these bottlenecks can lead to faster sales cycles – measured as sales velocity, or the time it takes to move a deal from initial contact to closing. Additionally, track lead conversion ratios, especially the progression from Marketing Qualified Leads (MQL) to Sales Qualified Leads (SQL) and ultimately to closed deals.
To ensure your dashboards remain effective, focus on five to seven key metrics that align with your sales goals. As Keren Rosenfeld, Marketing Director at SimilarTech, advises:
"Not all metrics are important to track and depending on your business some will be more important than the others".
By concentrating on the metrics that matter most, your team can stay focused on achieving success. Once you’ve tracked performance improvements, the next step is to calculate the financial impact of your dashboards.
Calculating ROI of CRM Dashboards
After identifying performance gains, it’s time to measure the financial return. ROI is calculated by comparing the benefits of your dashboards to their costs. Austin Caldwell, Senior Product Marketing Manager at NetSuite, explains:
"ROI is calculated by dividing the benefits of the investment by the costs of the investment; it is expressed as a percentage, the higher the better".
Benefits include increased revenue from improved conversion rates, time saved through automated reporting, and better customer retention due to enhanced insights. Costs cover software subscriptions, training, and implementation efforts. For example, if dashboards help grow revenue by $100,000 annually while CRM costs total $25,000 per year, your ROI would be 300%.
Efficiency gains also play a significant role in ROI. For instance, responding to leads within one minute can boost conversion rates by 391%. Dashboards with real-time alerts can help achieve this faster response time. Similarly, using dashboards for lead scoring can improve lead generation ROI by up to 70%.
Another key metric is revenue per sales rep. Comparing individual performance before and after dashboard implementation can reveal productivity gains. Additionally, track metrics like Cost Per Acquisition (CPA) and cost per qualified lead to ensure your sales and marketing efforts remain cost-effective.
To ensure accurate ROI calculations, maintain clean data. Regularly audit your CRM to eliminate duplicates and correct attribution errors. Integrating your CRM with accounting or ERP systems can automate financial tracking, reducing manual work and providing real-time insights into how dashboards influence your bottom line. Together, tracking performance improvements and calculating ROI validates your dashboard investment and helps guide strategic decisions.
Conclusion
CRM dashboards are changing the way sales teams approach their work by turning raw data into meaningful insights. Instead of spending hours compiling manual reports, teams can access continuously updated data that pinpoints bottlenecks and highlights which activities drive results. This makes it easier to focus on what truly matters, ensuring your efforts have the greatest impact. By moving away from guesswork and embracing data-driven decision-making, you can quickly spot process issues and take corrective action.
These insights don’t just make workflows more efficient – they also refine your strategic focus. By connecting specific activities to measurable results, you can strengthen accountability and identify areas for improvement. With automated dashboards that update in real time, there’s no need for manual data entry, and performance trends are flagged instantly. Whether you’re working on generating new leads or qualifying existing ones, the data provided by these tools supports smarter, more strategic decisions.
For small and medium-sized businesses aiming to grow, platforms like Teamgate CRM offer features such as customizable pipelines, multi-currency support, and advanced analytics that scale alongside your business.
The secret to success lies in focusing on metrics that truly matter. Align your tracking with your sales goals, monitor both outcomes and activities, and regularly calculate your ROI by comparing revenue gains with implementation costs. Understanding how your efforts translate into closed deals not only builds accountability but also motivates your team and drives continuous improvement.
From real-time insights to automated alerts, every feature of a CRM dashboard is designed to give sales teams the visibility and control they need to hit their targets consistently. Start using CRM dashboards today and take the guesswork out of achieving your sales goals.
FAQs
How do CRM dashboards help identify and resolve sales bottlenecks?
CRM dashboards offer a real-time, visual snapshot of your sales pipeline, making it easier to spot where deals might be stalling. By showcasing key metrics – like the number of deals at each stage, conversion rates, and reasons for lost opportunities – they help identify bottlenecks. For instance, you might notice lower activity levels or certain stages taking longer than expected.
These dashboards also let you filter data by time frame, salesperson, lead source, or product. This flexibility helps sales teams dig into the root causes of delays, whether it’s a lack of follow-up, inefficiencies in the process, or a specific stage creating roadblocks. Armed with these insights, teams can act quickly to fine-tune workflows and keep the pipeline flowing smoothly. Plus, built-in forecasting tools make it easier to prioritize changes, reduce potential revenue losses, and make smarter decisions.
How do predictive analytics in CRM dashboards enhance sales performance?
Predictive analytics integrated into CRM dashboards takes raw sales data and converts it into actionable insights. This allows sales teams to anticipate future outcomes with greater precision. By forecasting metrics like revenue, win probabilities, and lead scores, sales leaders can zero in on high-value opportunities, allocate resources more effectively, and speed up the sales cycle. This focused approach not only boosts win rates but also leads to a more reliable sales pipeline.
When powered by AI, these dashboards take predictions to the next level by offering automated insights and recommendations. This automation saves time, enables quicker decision-making, and helps sales managers spot trends, address potential revenue gaps, and adjust strategies in real time. With features like future sales forecasts and real-time tracking in U.S. dollars ($), CRM dashboards simplify the sales process, enhance forecast accuracy, and empower teams to hit their revenue targets more efficiently.
How can CRM dashboards enhance sales decision-making?
CRM dashboards serve as a powerful tool for sales teams, offering a clear and visual snapshot of critical sales metrics such as progress toward targets, conversion rates, and win rates. By transforming complex data into straightforward charts and graphs, these dashboards eliminate the need for time-consuming analysis, enabling quicker and more confident decision-making.
The real-time insights provided by these dashboards allow managers to quickly identify bottlenecks, monitor underperforming stages, and adapt strategies as needed. Features like forecasting tools and lead-value indicators make it easier to set realistic goals and predict revenue with greater accuracy. Additionally, a well-structured dashboard promotes teamwork by delivering a unified view of sales activities, ensuring everyone on the team is working with the same up-to-date information. These tools equip sales teams to make informed, data-driven choices that lead to better outcomes.