Most CRMs fail not because they lack features but because teams don’t use them consistently. The key to success isn’t stricter rules – it’s designing a CRM that works for your team, shaped by their feedback. When sales reps feel heard and see their input driving improvements, adoption becomes natural.
Here’s how you can bridge the gap between CRM implementation and true adoption:
- Set Up Feedback Channels: Use surveys, team discussions, and CRM usage data to gather insights.
- Analyze and Prioritize Feedback: Group feedback into themes and focus on high-impact barriers like manual tasks or unclear workflows.
- Make Targeted Changes: Adjust pipelines, automate repetitive tasks, and deliver quick wins to reduce friction.
- Train and Refine Continuously: Provide hands-on training and regular updates to ensure changes stick.
- Celebrate Progress: Recognize contributions and share success stories to maintain momentum.
Teamgate helps sales teams follow a clear process and gives managers trustworthy pipeline insights – without turning CRM into a full-time admin job.
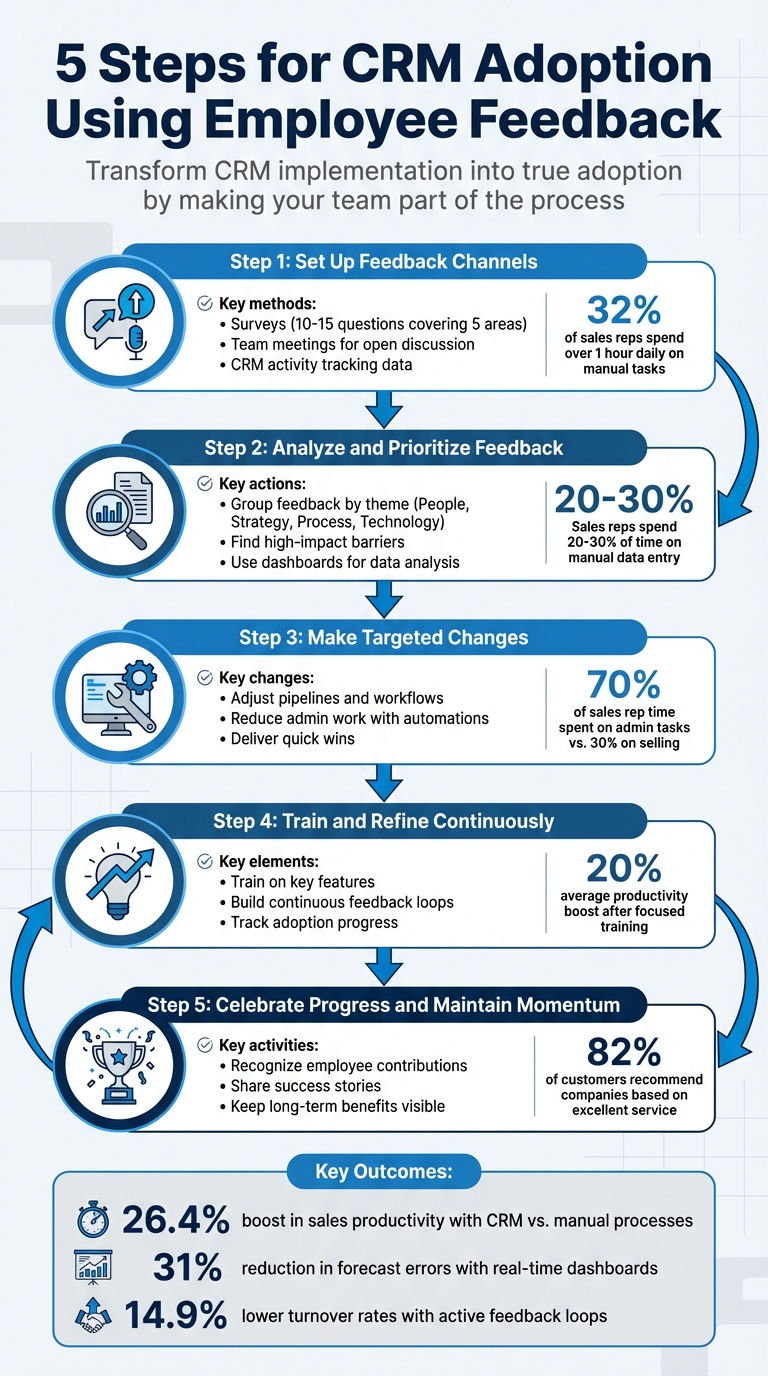
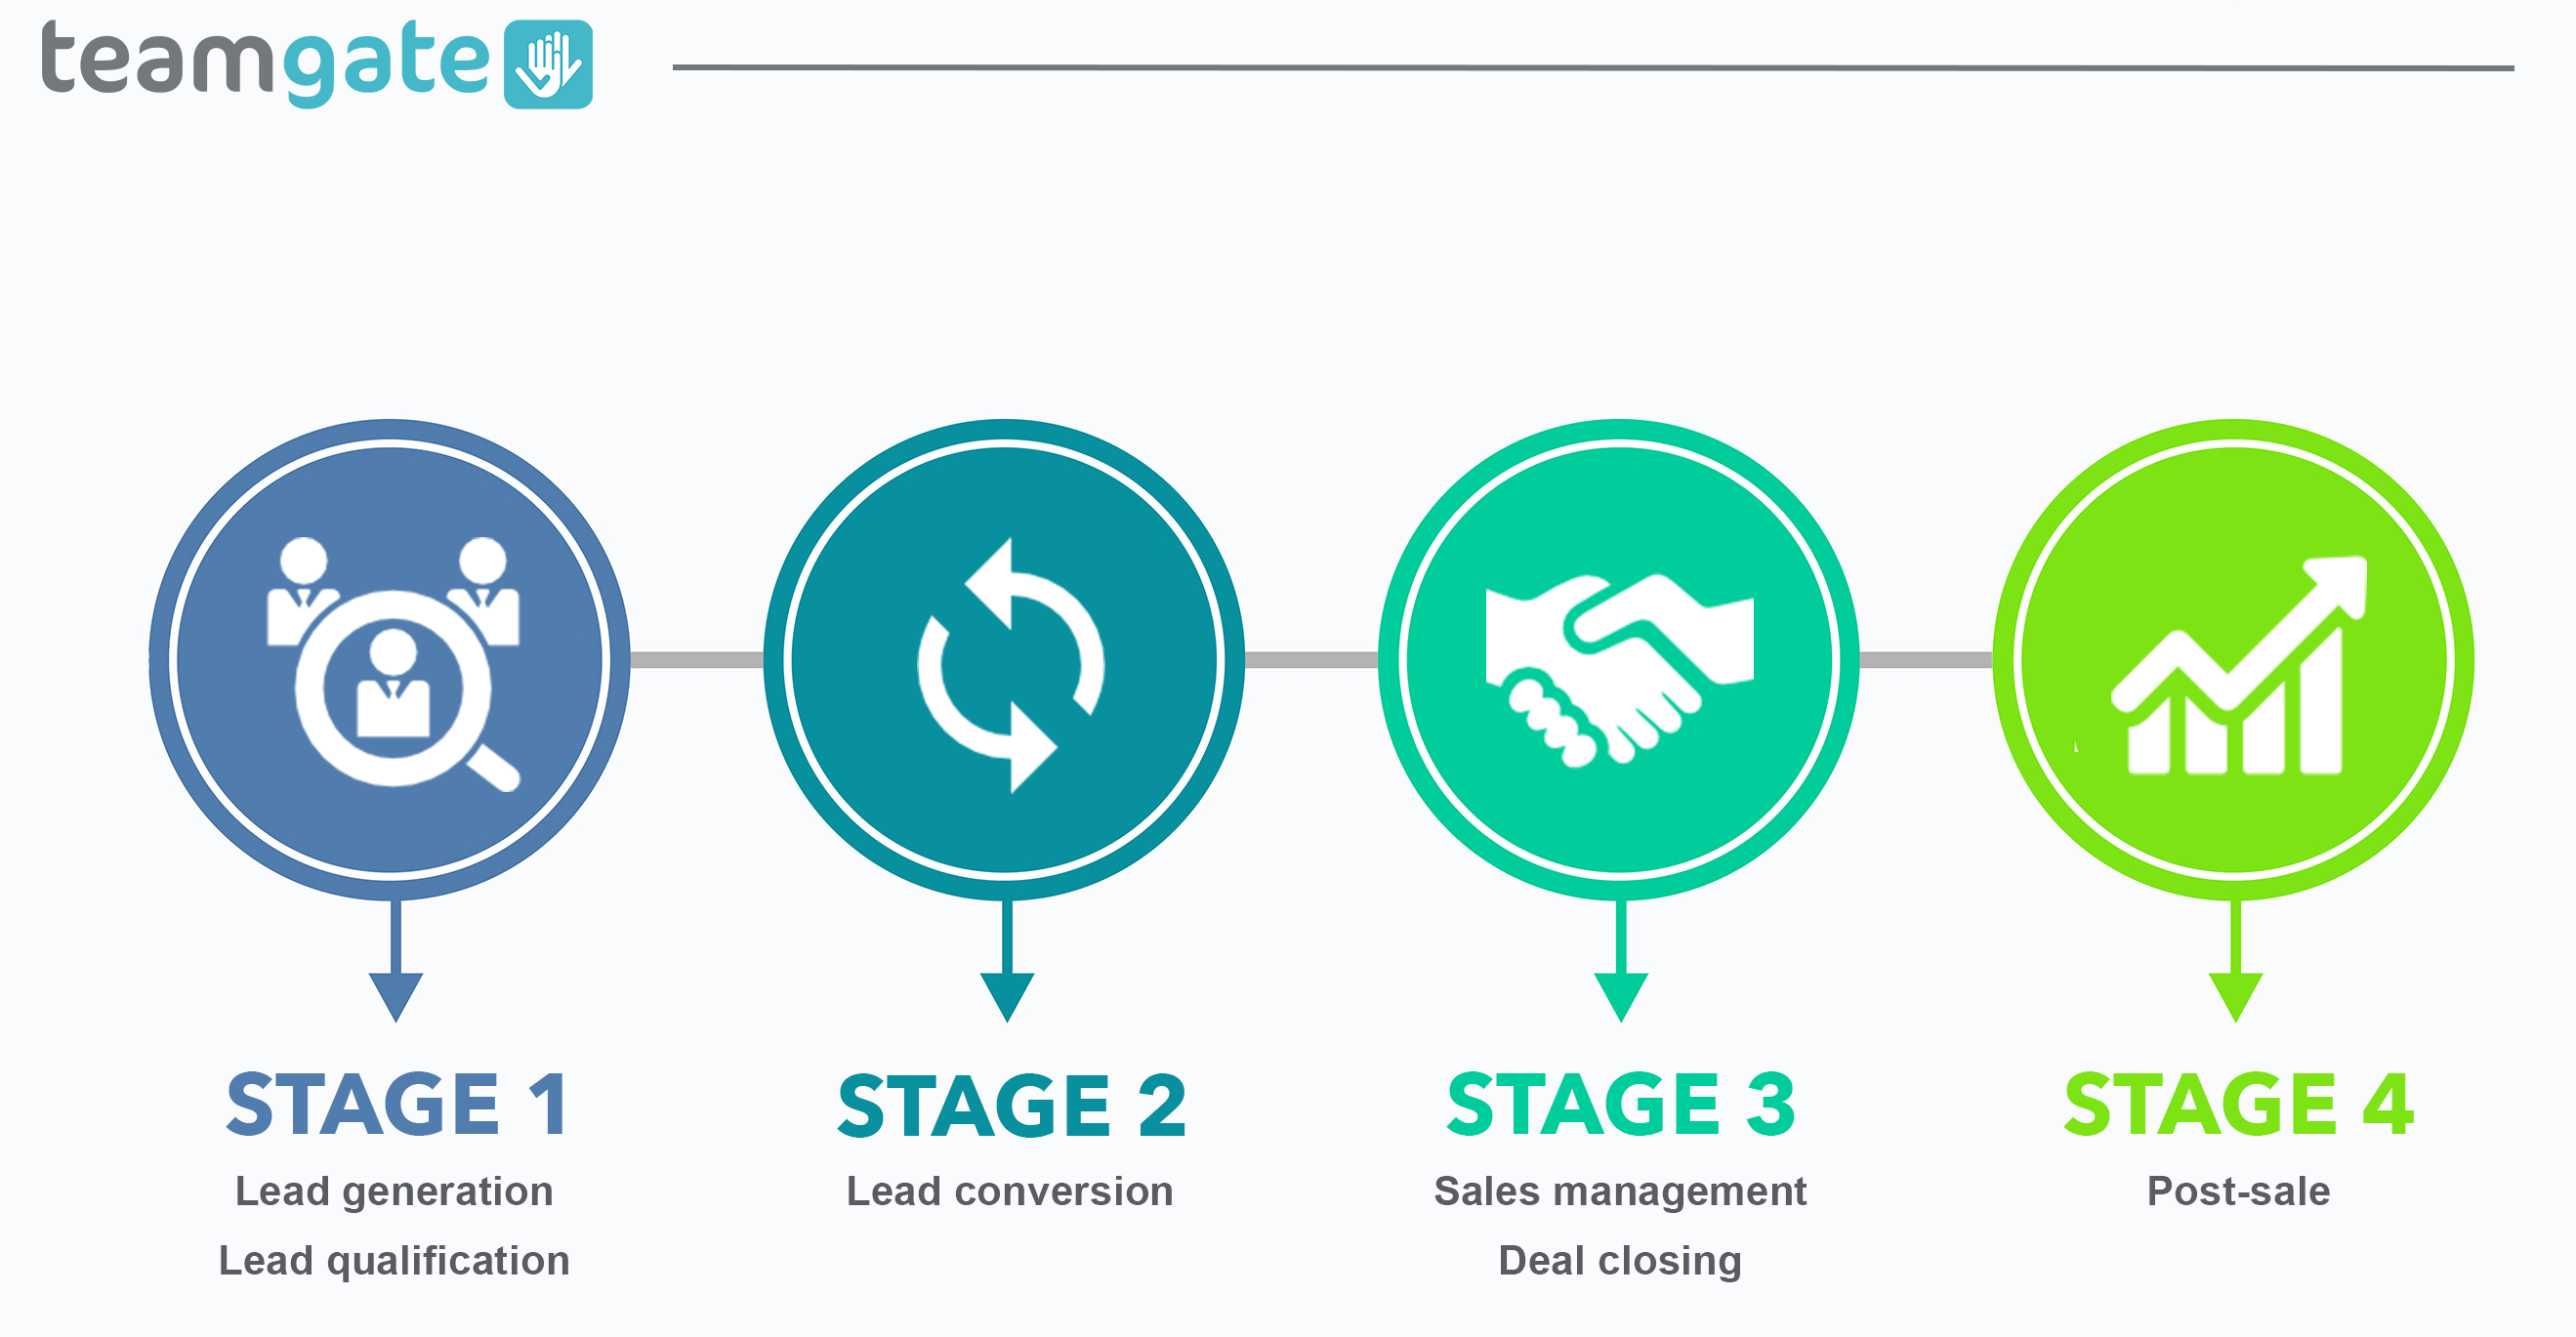
5-Step CRM Adoption Process Using Employee Feedback
CRM Implementation: Change Management for Sales Teams
Step 1: Set Up Feedback Channels
Improving CRM adoption starts with creating straightforward ways for your team to provide feedback. Without clear channels, you might miss out on valuable insights into their daily struggles and successes. The goal is to make it easy for team members to share concerns, suggest changes, and highlight tools that genuinely help them close deals. This can be achieved using surveys, open discussions, and analyzing usage data.
Use Surveys and Polls
Short surveys with 10–15 questions are a great way to gather actionable feedback. Mixing scaled questions (e.g., rating scales) with open-ended ones ensures you capture both measurable data and detailed input. Focus on five main areas: ease of use, features, training, productivity impact, and general suggestions. For example, you might ask, “How much time do you spend on manual data entry compared to selling?” This is especially relevant given that 32% of sales reps spend over an hour daily on manual tasks.
Timing is key. Avoid sending surveys during high-pressure periods, like the end of a sales quarter, to ensure thoughtful responses. Offering anonymity can also encourage reps to share honest opinions about system challenges or workflows.
"The best insights don’t always come from analytics dashboards – they come from the people who use the system every single day".
Once you’ve gathered responses, close the loop by acting on the feedback. For instance, if reps suggest automating lead entry, inform them when this change is implemented. Sharing specific actions builds trust and motivates future participation.
Hold Team Meetings for Open Discussion
Regular team meetings are an opportunity for open and constructive conversations. Use these sessions to hear real-time feedback, pain points, and improvement ideas directly from your reps.
Make your team part of the process. Instead of unilaterally deciding changes, involve them in decision-making.
"Leading your sales team is making them a part of the process. It’s letting them get their hands dirty with you and making them feel like it’s their decision as well".
Ask open-ended questions like, “What’s working well?” or “How can we improve the user experience?” This approach encourages honest dialogue. Additionally, securing buy-in from top performers can help solidify management’s decisions and reduce skepticism among others.
Frame discussions around value for the reps. For example, explain how logging objections in the CRM helps marketing create better content, which in turn makes selling easier. Above all, take feedback seriously – ignoring suggestions can erode trust. Always follow up on changes made based on team input to foster ongoing collaboration.
Review CRM Activity Tracking Data
Feedback isn’t just about what your team says – it’s also about what they do. CRM activity tracking can uncover patterns, underused features, and areas where reps might be struggling or defaulting to old habits like spreadsheets.
Monitor key metrics such as record creation rates, task completion, and deals stuck in pipeline stages without next steps. If certain fields or features are consistently skipped, it could signal confusion, complexity, or misaligned workflows.
Teamgate CRM provides detailed activity tracking, offering insights into how your team interacts with the system daily. You can identify which features are being utilized, where deals are stalling, and whether follow-up tasks are completed on time. This data complements feedback from surveys and meetings, giving you a well-rounded view of adoption challenges.
Pay attention to common support requests or training issues. For instance, if multiple reps struggle with the same task, it’s a sign that either the feature needs simplification or training needs improvement. Aligning behavioral data with team feedback ensures your CRM evolves to meet their needs effectively.
Step 2: Analyze and Prioritize Feedback
Once you’ve set up your feedback channels, the next step is to organize that input into actionable insights. Raw feedback can feel overwhelming, but grouping it into themes helps you zero in on the changes that will have the biggest impact on daily CRM usage.
Group Feedback by Theme
Start by sorting feedback into clear categories. You can divide it into four main areas: People (training and motivation), Strategy (alignment with business goals), Process (workflows and methods), and Technology (features and tools). This structure makes it easier to identify patterns. For instance, if multiple reps mention confusion about pipeline stages, it likely points to a Process issue rather than a Technology one.
Another way to group feedback is by its effect on sales efficiency. Look for recurring themes like a complicated user interface, missing integrations, or excessive admin work.
It’s also helpful to consider feedback based on user adoption levels. Power users who have mastered the CRM will have different insights than those still struggling to get started. Using a tiered system – from "license activated" to "system ambassador" – can help you determine whether feedback reflects a training gap or a genuine system limitation. For example, a feature request from an occasional user carries less weight than one from a top performer who has fully explored the CRM’s potential.
"In order to successfully implement a CRM system, you need to first pick the features of the CRM system that you chose that support both your strategies and processes. You can simply ignore all the other features."
– Flowlu Team
Once feedback is grouped, shift your focus to identifying the obstacles that most directly impact daily adoption.
Find High-Impact Barriers
After identifying themes, prioritize the issues that disrupt sales processes the most. Focus on barriers that directly hinder adoption, such as unclear workflows, excessive data entry, or missing features that force reps to rely on spreadsheets. Consider this: sales reps spend 20% to 30% of their time on manual data entry. If feedback highlights similar challenges, aim to cut that time to around 10%.
One practical approach is to shadow low-adoption users for a day to see where they struggle and resort to workarounds. François Fillette, CEO of Akimbo, sums it up well:
"Sales people don’t care about CRM itself. They are looking for simplicity and profitability".
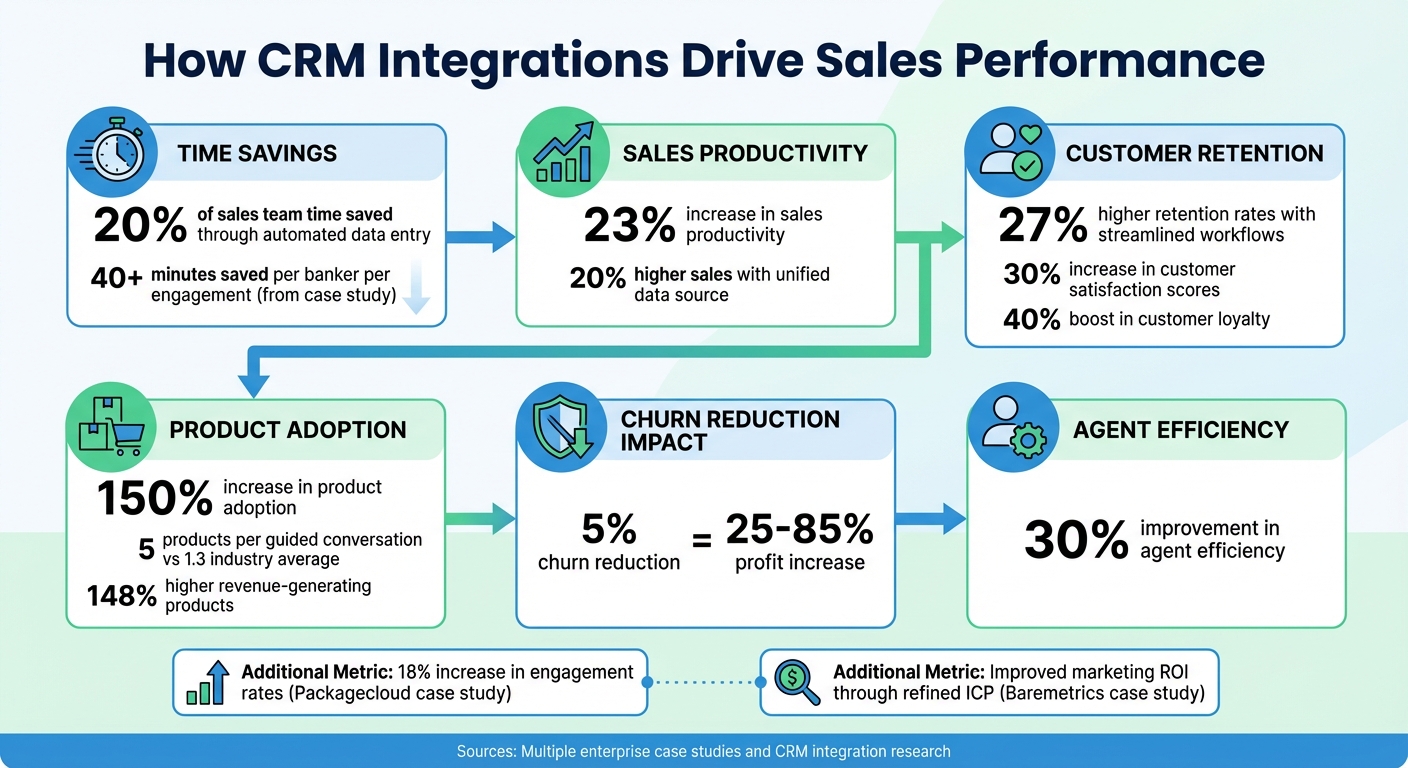
Map the feedback to your sales journey – from lead to close – and note where deals stall. For example, proposals without clear next steps or missed follow-ups due to non-automated reminders are clear signals of trouble. Companies using CRM systems report a 26.4% boost in sales productivity compared to manual processes, but this only happens when the CRM aligns with real-world sales methods. To reduce manual data entry and connect your data seamlessly across systems, many teams also integrate Integrate.io to automate data flows from emails, forms, and other sources directly into the CRM.
| Feedback Theme | Focus Area | Goal |
|---|---|---|
| Usability | User Interface & Navigation | Make the CRM faster and easier to use |
| Integration | Connection with other tools | Eliminate manual data transfers |
| Automation | Reducing admin tasks | Reduce manual data entry from 30% to 10% |
| Training | Feature mastery | Help users advance to expert levels |
| Process | Workflow alignment | Ensure the CRM mirrors actual sales steps |
Use Teamgate Dashboards for Data Analysis
Teamgate’s dashboards can help you analyze feedback by highlighting low-usage areas and workflow bottlenecks. They track metrics like login frequency, data entry consistency, and feature usage. For example, if certain pipeline stages routinely have incomplete records or aging deals with no next steps, it’s a clear sign of confusion or misaligned workflows.
Dashboards also reveal critical gaps. If you notice a shortfall in scheduled follow-up tasks compared to expected benchmarks, it might mean reps either don’t know how to set reminders or find the process too complicated. This gives you a clear starting point for improvements.
Teamgate surfaces key metrics like deal age, activity, and next-step coverage, helping you distinguish between a healthy pipeline and one filled with stalled deals. If feedback points to lost opportunities, you can verify it by checking overdue tasks and stalled deals. Real-time dashboards reduce forecast errors by 31%, enabling you to base coaching and adjustments on hard data instead of guesswork.
Step 3: Make Targeted Changes
With feedback collected and prioritized, it’s time to focus on specific adjustments that improve daily CRM usage. Address the friction points your team has flagged to eliminate obstacles in their workflow and make the CRM a tool that genuinely supports their sales process.
Adjust Pipelines and Workflows
Begin by aligning your pipeline stages with how your team actually sells. If feedback reveals confusion about moving deals forward or identifies redundant stages, it’s a clear sign that your CRM structure needs a refresh. Sales strategy expert Sam Queen emphasizes:
"If your CRM isn’t structured the right way, and your team isn’t committed to following that structure, you won’t have the data you need."
Skipped steps or incomplete fields often highlight workflow issues, not laziness. For instance, if the "Proposal Sent" stage feels unclear, consider breaking it into "Proposal Sent" and "Negotiation", with clear next steps for each. Teamgate simplifies this process by allowing you to customize pipeline stages and set action requirements, ensuring nothing slips through the cracks.
Additionally, review objections logged in the CRM. If prospects consistently stall at a specific stage, it might indicate a need to refine your sales process. Involve a top-performing rep early on to help shape and promote these changes, building trust within the team.
Once workflows are optimized, the next step is to reduce repetitive tasks.
Reduce Admin Work with Automations
Admin tasks consume a staggering 70% of a sales rep’s time, leaving only 30% for actual selling. If your team’s feedback points to excessive data entry, manual follow-ups, or time spent building reports, automation can be a game-changer.
Focus on automations that integrate seamlessly into your team’s workflow. For example, automate lead routing, task creation, and deal updates. A simple automation, like creating a follow-up task when a proposal email is sent, can save significant time. Teamgate’s workflow automations handle these repetitive tasks, making consistent follow-up effortless.
Provide pre-built email and SMS templates for common scenarios – such as post-call follow-ups, re-engaging cold leads, or post-demo check-ins. Use clear naming conventions so reps can quickly find the right template. These small changes save hours each week and reduce the mental load of crafting messages from scratch.
Tim Cakir, Founder of AI Operator, sums it up perfectly:
"If your team isn’t updating the CRM, the problem isn’t your team. Legacy systems were never designed around how reps work."
For a 10-person sales team, effective automation can free up the equivalent of four to seven full-time reps’ worth of selling capacity.
Deliver Quick Wins
Quick, visible improvements can build trust and encourage ongoing engagement. When reps see that their feedback leads to real changes within days, they’re more likely to stay invested in the CRM and continue sharing insights.
Focus on fixes that provide immediate relief. For example:
- If reps struggle to find resources, create a searchable template library with clear naming.
- If manual data entry is a pain point, automate lead capture from web forms or emails.
- If follow-ups are being missed, set up reminder automations.
These changes can have a daily impact. For instance, automating follow-up tasks might result in a 20% boost in productivity. Translate that into real outcomes, like more closed deals and higher commissions.
Quick wins also show that leadership is listening. When a rep’s suggestion goes live within a week, it reinforces that their input matters and builds momentum, turning skeptics into advocates for the CRM.
| Change Type | Example | Impact |
|---|---|---|
| Pipeline Adjustment | Split "Proposal Sent" into "Proposal Sent" and "Negotiation" | Clearer next steps, fewer stalled deals |
| Automation | Auto-create follow-up tasks when a proposal email is sent | Saves 10–15 hours/week per rep |
| Template Library | Pre-built emails for common scenarios with clear naming | Faster outreach, consistent messaging |
| Data Capture | Automatically log calls and emails to deal records | Eliminates manual entry, improves accuracy |
sbb-itb-5772723
Step 4: Train and Refine Continuously
Making targeted changes is only half the battle – continuous training ensures those changes stick and lead to measurable results. Without ongoing education and feedback, even the most promising updates can fall flat. Your team needs to know not just how to use new features but also why they matter for closing deals. Sales strategy expert Sam Queen highlights the common pitfall of neglecting proper resources:
"People love to roll out new tech without creating supplemental resources, loom videos, walkthroughs, SOPs, etc."
Without robust training, your CRM risks becoming an underutilized tool instead of a system that drives revenue. Regular refinement ensures your CRM evolves alongside your sales strategies, reinforcing disciplined selling and accurate pipeline management – key principles of Teamgate CRM. Pairing training with consistent feedback keeps the system aligned with your team’s needs.
Train on Key Features
Focus your training efforts on essential features like email integration, task reminders, and reporting tools. Provide a clear system overview, short walkthrough videos, and a competency test to ensure readiness before reps dive into live sales. For example, in Teamgate, this could mean showing reps how to connect their email accounts for automatic conversation logging, set up task reminders to avoid missed follow-ups, and generate reports that highlight deal health and next steps.
A simple competency test – such as creating a deal, logging a call, and scheduling a follow-up task – can confirm that reps are prepared to use the CRM effectively. Proper training can lead to measurable results; teams that previously struggled with CRM adoption often see an average 20% boost in productivity after focused training.
Once the basics are mastered, ongoing feedback ensures the CRM continues to support daily sales activities effectively.
Build Continuous Feedback Loops
Create a four-step feedback cycle: gather input, act on it, monitor results, and repeat. Use anonymous surveys and team discussions to collect feedback, and appoint CRM champions to share insights from the ground level. These power users can help identify problems before they hinder adoption.
A great example comes from ARC Document Solutions, which achieved 100% user adoption in 2024 after migrating 200 sales reps to a new CRM. By prioritizing user experience and tailoring training based on rep feedback, they saw reps respond to leads 94% faster and experienced a 133% year-over-year increase in new business growth. Monthly meetings to review CRM performance and gather input played a key role in this success.
Feedback should always be specific, actionable, and timely. If a rep finds reporting confusing, dig deeper: Which report? What details are they looking for? Use these insights to create pre-built dashboards in Teamgate that highlight critical metrics like deal age, activity levels, and next-step coverage.
Track Adoption Progress
Continuous feedback and training should be paired with metrics to measure adoption progress. Track usage data – such as login rates, record creation, completed tasks, and emails sent – to identify where gaps in understanding or data quality may exist. These insights can guide targeted training efforts. Teamgate’s reporting tools make it simple to analyze patterns and spot areas for improvement.
For example, low email integration usage might signal the need for additional walkthroughs. Similarly, regular audits of data quality can reveal whether reps understand how to properly enter information. If deal stages are skipped or fields are left incomplete, address these issues with focused training and process updates.
| Metric Category | What to Measure | Purpose |
|---|---|---|
| Usage | Login rates | Verifies basic access and initial adoption |
| Behavior | Record creation, tasks completed, emails sent | Checks if training leads to active feature use |
| Data Quality | Accuracy and completeness of entries | Shows whether reps understand data entry protocols |
Organizations that actively seek and act on employee feedback see 14.9% lower turnover rates. When reps notice their input leading to tangible improvements, they stay engaged – not just with the CRM but with your company as a whole.
Step 5: Celebrate Progress and Maintain Momentum
The journey to CRM adoption doesn’t conclude when the system goes live – it thrives when your team integrates it into their daily workflow. To ensure this, it’s crucial to celebrate progress and keep the momentum alive. Acknowledging contributions and showcasing the system’s benefits can transform compliance into commitment. When reps see their feedback being implemented and understand the value of the CRM, they start viewing it as an essential tool rather than just another management requirement.
Recognize Employee Contributions
Acknowledging your team’s efforts can have a profound impact. Publicly recognizing reps who provide valuable feedback or consistently use the CRM effectively not only boosts morale but also encourages others to follow suit. Engaging top performers early in the process can amplify this effect, as their influence often shapes team behavior.
As Sales Strategy and CRM Expert Sam Queen notes, "Of course, business owners and sales managers have influence over a company. But when it comes down to it, usually your top performer has the most influence." Highlighting specific successes – like a rep’s suggestion to simplify pipeline stages leading to measurable improvements – through team meetings, newsletters, or Slack channels can inspire broader adoption.
Share Success Stories
Concrete examples resonate more than abstract promises. Share stories that highlight how CRM usage directly benefits the team. For instance, a rep’s habit of logging prospect objections in Teamgate could lead to marketing creating targeted content, which then helps the entire sales team address similar objections more effectively. This kind of "objection-to-content loop" demonstrates that CRM data isn’t just busywork – it’s actionable intelligence that makes everyone’s job easier.
Make it personal by showing how CRM discipline leads to tangible rewards. Teams that adhere to CRM processes and automation often see an average 20% increase in productivity. For sales reps, this translates into more closed deals, higher commissions, and less time wasted on unproductive tasks. Use Teamgate’s dashboards to visualize these wins, such as faster deal progression, fewer overdue tasks, and improved forecast accuracy.
Keep Long-Term Benefits Visible
Adoption can wane if the team loses sight of the CRM’s purpose. Keep its value top of mind by regularly sharing updates that connect directly to business outcomes. Leverage Teamgate’s role-based dashboards to give reps real-time insights into how their efforts are driving results. For example, when a rep sees that consistent follow-ups have moved deals from "consideration" to "decision" in just a week, the CRM becomes an indispensable tool.
Track key adoption metrics like closed deals and team morale. If these indicators aren’t improving, it might signal that the CRM isn’t fully embedded in daily routines. Schedule regular check-ins to assess CRM performance, gather feedback, and make incremental adjustments. Remember, 94% of customers say a positive service experience increases their likelihood of repeat business. This starts with your team’s ability to deliver timely, personalized follow-ups – a process made seamless with Teamgate. By emphasizing how the system prevents revenue loss and ensures no deal is left without a next step, you can keep the CRM central to daily operations and set the foundation for long-term success.
Conclusion
Getting your team to embrace and use a CRM effectively starts with making them feel like they own the system. The five steps in this guide – opening feedback channels, analyzing input, implementing changes, offering ongoing training, and celebrating progress – create a structure for Sales CRM implementation where your team’s input shapes the tool they rely on every day. As Sales Strategy and CRM Expert Sam Queen explains:
"Leading your sales team is making them a part of the process. It’s letting them get their hands dirty with you and making them feel like it’s their decision as well."
By focusing on feedback-driven strategies, you ensure clean data, quicker deal closures, and a CRM that doesn’t gather dust. You’re tackling issues before they grow into bigger problems, and you’re creating a system that evolves alongside your team’s needs. Teamgate, for example, helps reps follow a clear sales process while managers gain trust in the numbers – without turning CRM into a full-time admin job.
The importance of getting this right can’t be overstated. 82% of customers say they’d recommend a company based on excellent customer service. Delivering that kind of service requires timely, personalized follow-ups – something a CRM like Teamgate is built to support. But even the best technology won’t succeed if your team doesn’t buy in. Without their commitment, your CRM won’t deliver the return on investment you’re aiming for.
Making feedback a core part of your CRM strategy ensures it evolves with your business. It shifts adoption from a one-time event to an ongoing process of improvement. This isn’t just about using a CRM – it’s about plugging revenue leaks caused by stalled deals and missed follow-ups. When your team sees their feedback leading to real improvements – like automated lead routing or workflows that cut down on busywork – they’ll stop seeing the CRM as a chore and start seeing it as a tool that drives success.
FAQs
Which CRM adoption metrics matter most?
The most critical CRM adoption metrics focus on user engagement and the system’s effectiveness in supporting business processes. Key indicators include:
- Usage rates: How many team members are actively using the CRM.
- Data quality: The accuracy and completeness of information entered into the system.
- Alignment with adoption goals: How well the CRM meets the intended objectives.
These metrics reveal areas that need improvement, help fine-tune strategies, and ensure the CRM enhances workflows, boosts productivity, and improves revenue forecasting.
How can I quickly prioritize employee CRM feedback?
To make employee feedback on your CRM truly count, start by actively collecting their input and organizing it systematically. Use digital tools to store and review feedback, making it easier to spot recurring issues or significant obstacles. Focus on addressing the most pressing concerns first by developing a clear action plan to implement quick fixes. Keep the momentum going by regularly revisiting feedback, making adjustments, and showing employees their input matters. This approach not only keeps the CRM aligned with their needs but also encourages quicker adoption and ongoing improvements.
What are the best quick wins to boost CRM adoption?
The quickest ways to improve CRM adoption are to involve your team from the start, offer the right tools and training, and tackle obstacles as they arise. Including employees in the CRM selection process helps create a sense of ownership and minimizes pushback. Equipping them with proper training and resources boosts both confidence and productivity. Addressing technical or other challenges early ensures the transition is smoother and encourages regular use as part of everyday tasks.